
- Introduction
- Limitations
- Edge Processor vs Ingest Actions
- How to use the Edge Processor solution
- Index creation
- Configuration
- First Time setup
- Destinations
- Edge Processor
- Install/Uninstall
- Pipelines
- Testing/Validation
- Configure/Verify data sources
- Troubleshooting
- Tips & Tricks
- Conclusion
Introduction
Splunk 10 was released on July 28, 2025.
One of the main new feature is the Edge Processor. The Edge Processor solution is “a service hosted within your Splunk Enterprise deployment designed to help you manage data ingestion within your network boundaries. Use the Edge Processor solution to filter, mask, and transform your data close to its source before routing the processed data to external environments. “.
Limitations
The Edge Processor instance is limited to all Linux OS supported for Splunk Enterprise.
Please also be advised that I completely removed any certificate management from that article for simplicity purposes. Please use TLS/mTLS and security features on your own environments.
Edge Processor vs Ingest Actions
It is different from the Ingest Actions: Ingest Actions manipulates props and tranforms files while Edge Processor creates pipelines using SPL2 language to manipulate your data.
Both have a Graphical User Interface, are included in the global cost of Splunk (Enterprise ou Cloud) and can route data to other destinations.
Last but not least, the Edge Processor is to be used close to the sources, as the Ingest Actions are far away from the data source (if you decide to install it on the indexing tier for example).
For the outputs, you can route the data to Amazon S3, Splunk Enterprise or Splunk Cloud platform elements.
You can find a comparison table here.
How to use the Edge Processor solution
The Edge Processor solution consists on a Data Management control plane installed on a Splunk instance. It is better if installed on a dedicated machine. From that control plane, you install your Edge instances on Linux machines only (via a script given by the UI).
All is centralized in the Data Management application found in the Splunk app menu.
The control plane centralizes the configuration that is the distributed to Edge instances via the Splunk API management port (tcp/8089).
The configuration is made of :
- the edge instance
- the pipelines
- the destinations were to send the logs to.
Compared to Cribl, the sources are very limited. The available sources are:
- Syslog
- HEC
- Splunk forwarders (Splunk-to-Splunk, aka S2S)
Once you create the configuration and the pipelines, they are applied to the Edge Processor instances you want, and the magic happens.
Configuration
First Time Setup
The first time you open the Data Management app (on the machine you assigned the Data Management control plane‘s role), you are asked to complete the First-Time setup:
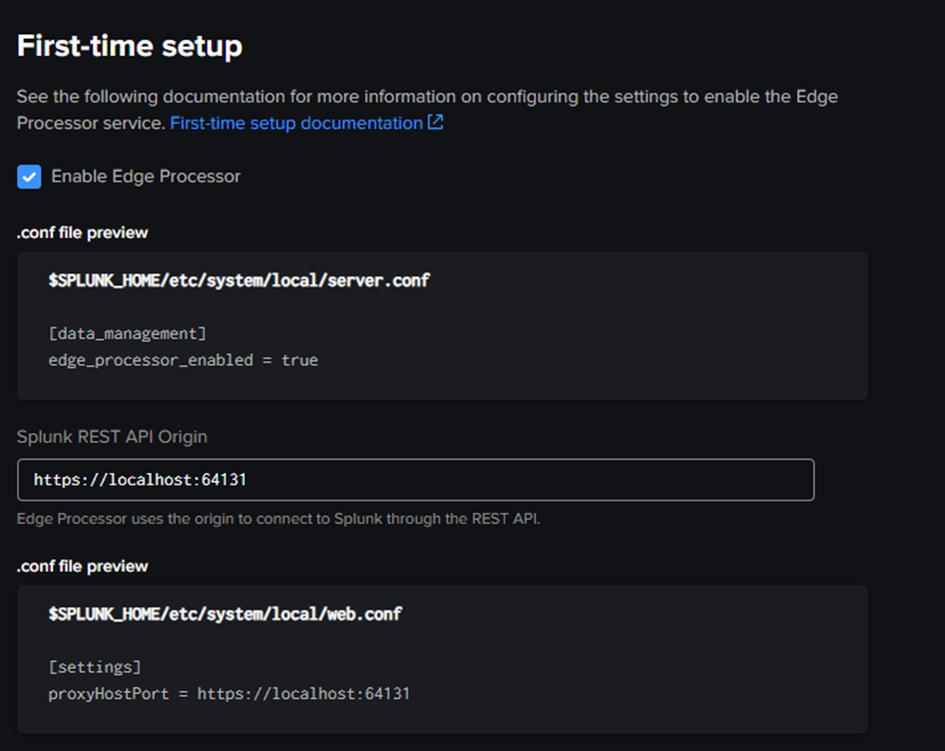
By default you enter the https://hostname:8089 for the Splunk REST API Origin. This modifies the .conf files mentioned in the GUI, then you must restart Splunk.
After the restart, go back to the Data Management app:
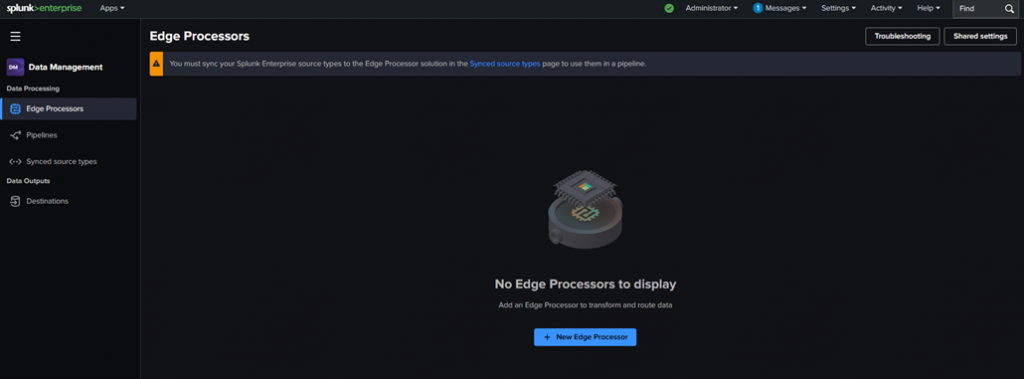
The second thing to do is to create a new …. Destination ! It is for more convenience that I advise to create the Destination before creating a new Edge Processor.
Destinations
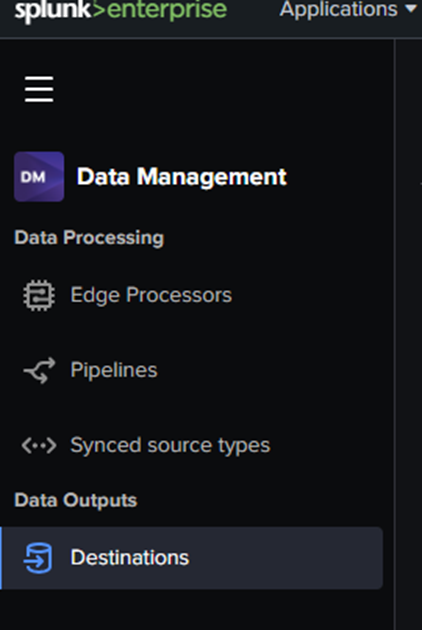
Click on Destinations/ + New Destination.
Choose the destination type. Here we chose Splunk Platform S2S (Splunk -to-Splunk) for our example.
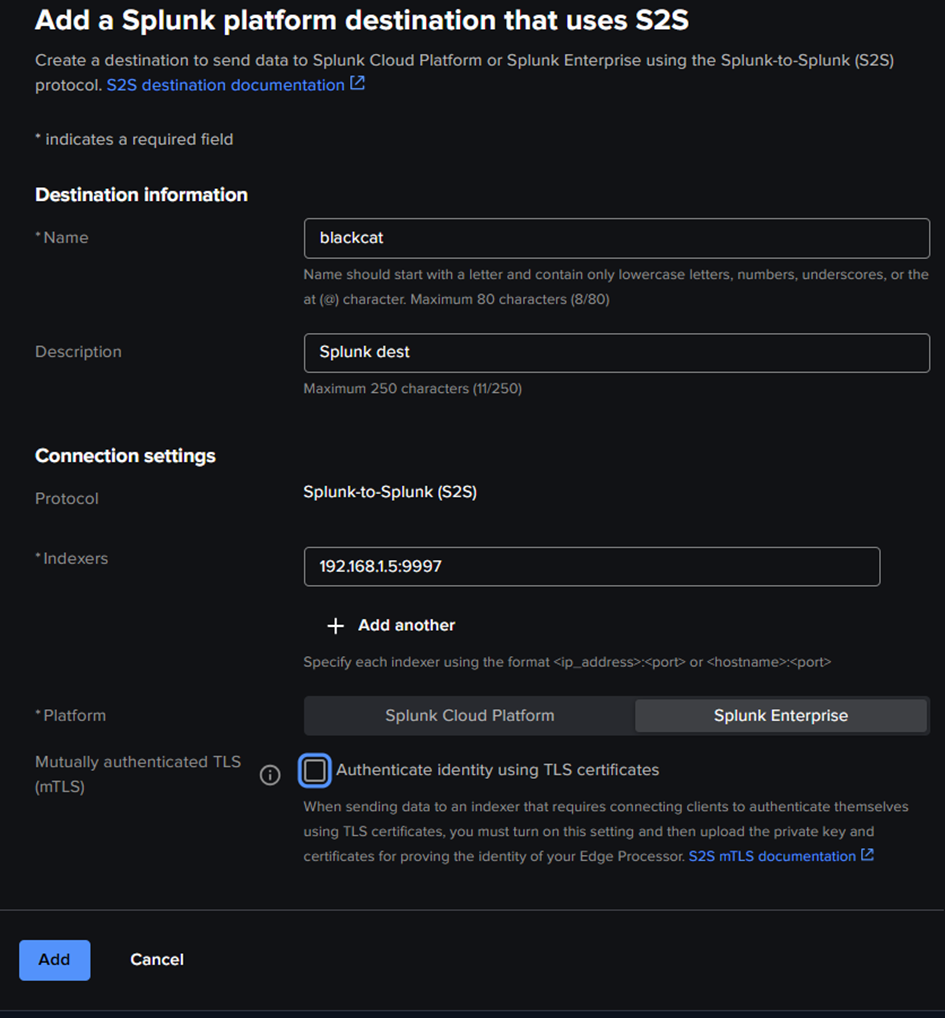
For testing purposes, no mTLS was set up. You can choose an indexer or any Splunk instance (standalone HF) to receive the data on S2S port (tcp/9997), or multiple ones by clicking “+ Add another“. Don’t forget to Add.
Remember that this setup is for the Edge instance (i.e. the agent that will manipulate data, not the Data Management control plane on which you are configuring).
You can now add a new Edge Processor.
Edge Processor
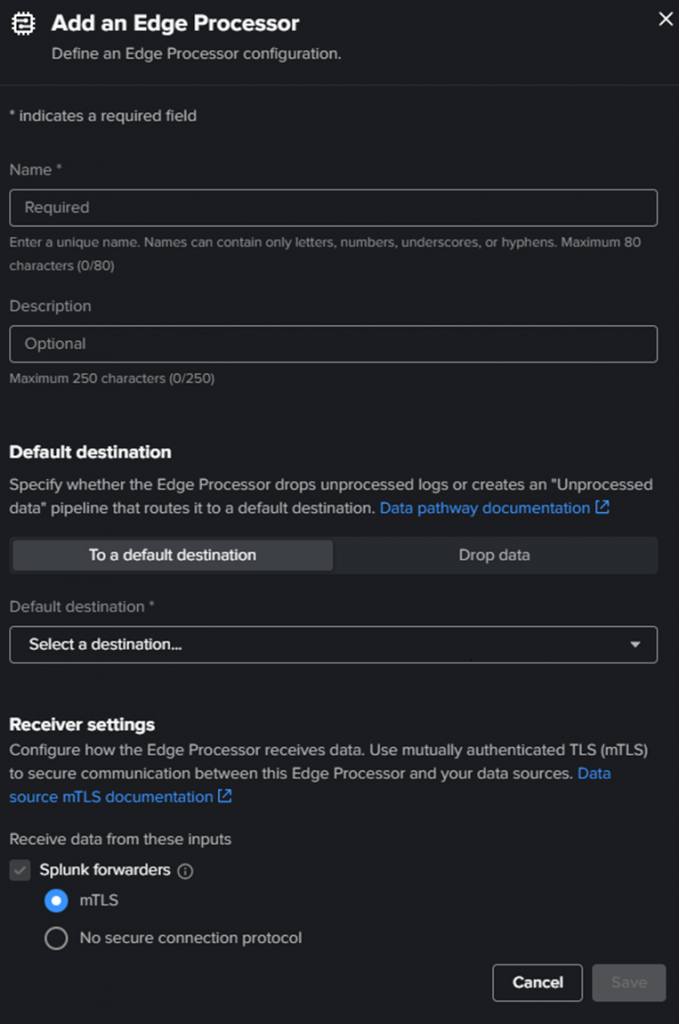
Enter a name and a description.
Then Select a destination. The default is default_telemetry_index as a Splunk Platform S2S, but as we created the destination just before, select the one you created.
For the receiver settings, choose the one that matches the logs you want to process in Edge Processor.
You can enable all of them if you want.
mTLS is selected by default, but for test purposes, we keep the connections in clear protocol. Click “Save“.
The edge processor is then created.
You will get additional tabs on the screen, with Install/Uninstall button.
Install / Uninstall
The button delivers you the script that must be run on the Edge instance (agent treating the data). At first and until a running healthy instance is discovered, you will only get the “Install” script.
The “Uninstall” script will only appear then. This can be helpful to have this script to remove the installed instance if something goes wrong.
Here it is:
# Get the PID of the splunk-edge process SPLUNK_EDGE_PID=$(pidof -x splunk-edge) # Get the directory of the splunk-edge process SPLUNK_EDGE_DIRECTORY=$(pwdx $SPLUNK_EDGE_PID | awk '{print $2}') # Create a token file containing the authentication token that allows the Edge Processor instance to disconnect from Splunk echo "eyJraWQiOiJzcGx1bmsuc2VjcmV0IiwiYWxnIjoiSFM1MTIiLCJ2ZXIiOiJ2MiIsInR0eXAiOiJzdGF0aWMifQ.eyJpc3MiOiJhZG1pbiBmcm9tIGhmMSIsInN1YiI6ImFkbWluIiwiYXVkIjoiZXAtaW5zdGFuY2UiLCJpZHAiOiJTcGx1bmsiLCJqdGkiOiIyMTU5M2Y3OTI2N2VjYjUxYzdjMDU2NGI4YzA5NzJmZTFlNGZkZWM2N2Q0YjMwM2E5NDAyNmYxNzI4OTRjODdlIiwiaWF0IjoxNzU2NDY5MTUwLCJleHAiOjE3NTkwNjExNTAsIm5iciI6MTc1NjQ2OTE1MH0.pHKEHEutVmjrdSbmLc0l4_J2ksWR0DgtBfAAznW5qDHNFAWTF0v4yFLR433ML4QzF4ROd6uUlLO0iXs_rZUyzw" > splunk-edge/var/token cd $SPLUNK_EDGE_DIRECTORY kill $SPLUNK_EDGE_PID while kill -0 "$SPLUNK_EDGE_PID" 2>/dev/null; do sleep 0.2 done
This token is directly set in the script and should match the one used when running the installation script. So keep/store this token somewhere, “just in case”.
Pipelines
Now we have defined an Edge Processor and where to send data, we need to apply transformations to these data.
You can add a Pipeline from the left menu, then Add pipeline.
As written earlier, the pipeline uses the SPL2 language to process the pipelines. You can find additional info on the SPL2 Language here (introduction to SPL2).
Several pipeline templates are provided:
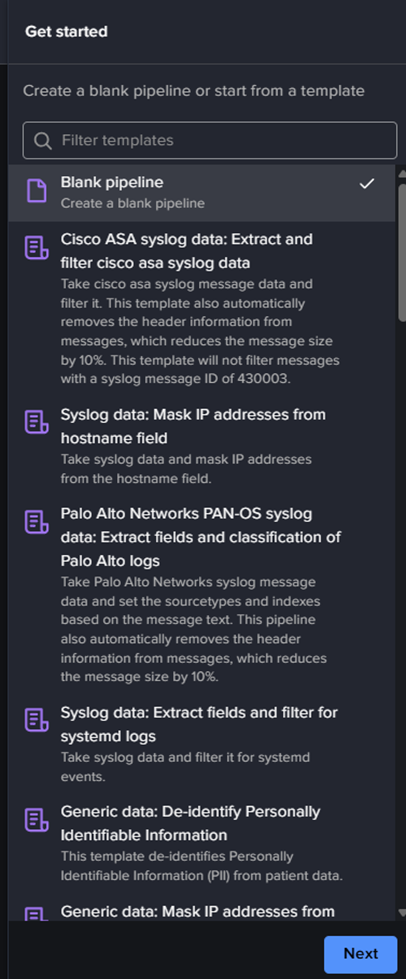
You can select one of them to see how to create one or select “Blank pipeline“. Then “Next“.
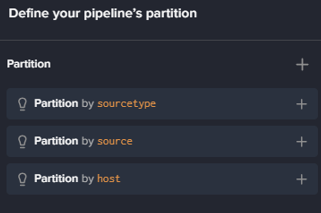
You will then have to choose a “partition“: which subset of data will that pipeline process ?
There are only 3 choices : by sourcetype, source or host (3 of the default Splunk metadata). Remember that for logs coming directly from a syslog, you won’t have any sourcetype, or source, defined. So you will be limited to the host selection (but that covers most of your syslog use cases).
Once the partitioning is set, click on Next.
You will get a screen where sample data can be uploaded. It will help you too test if the pipeline is correctly working. You can upload a file (RAW or .CSV) or you can Skip. After clicking on Next button, you have to select a destination where to send logs. Once you choose the destination, you have 3 choices again :
- Default: if there is a metadata specifying an index in the event, it will be sent to it, otherwise to the default index,
- Specify index for events with no index : if no index metadata in the event, it is sent to the specified index,
- Specify index for all events: self explanatory
Click “Done” button when finished.
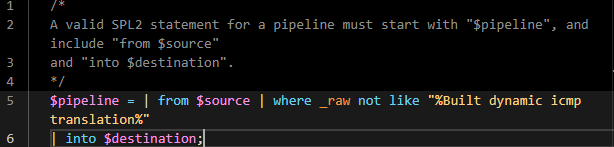
You get a new GUI screen where you can define your SPL2 pipeline
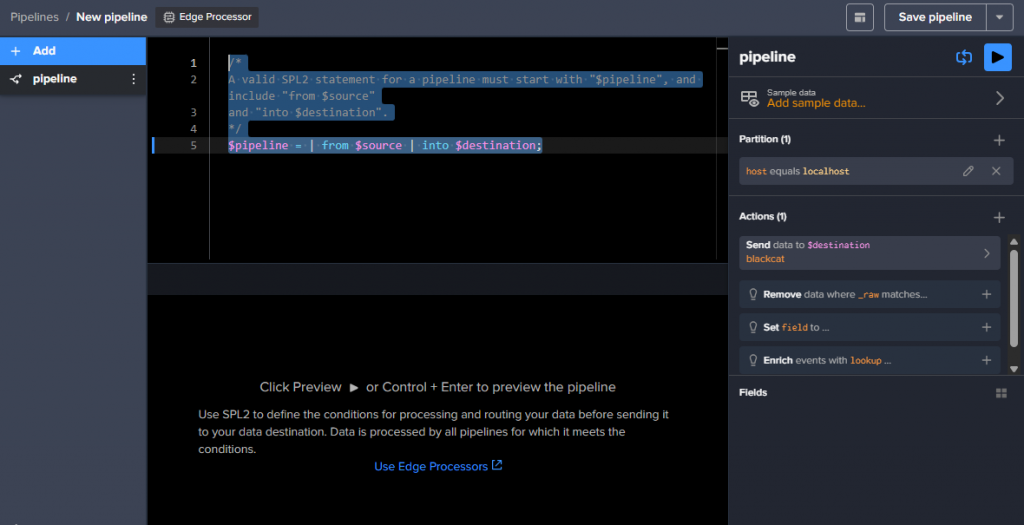
You can still add sample data, edit your partition and/or destination, add some other Actions directly with the GUI, it will create/modify the SPL2 text of the pipeline.
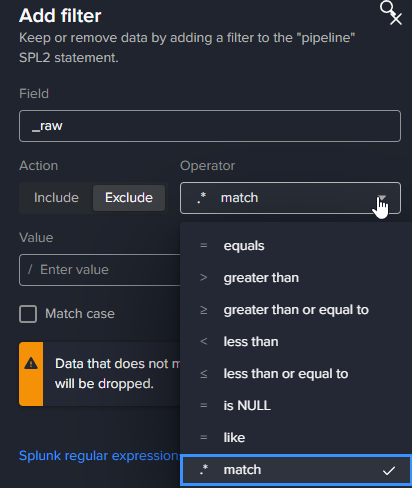
Add a filter:
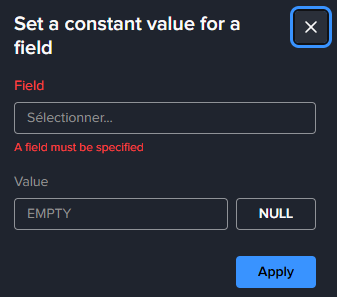
Set fields…
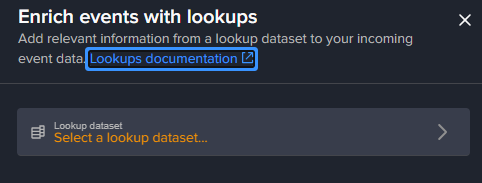
or add a lookup dataset..
The preview of the filter is automatic, but you need to add sample data, otherwise the preview does not work.
On the left you can add Statements, that add a search in the pipeline. when you do, you get a new panel on the right to choose the dataset where to search:
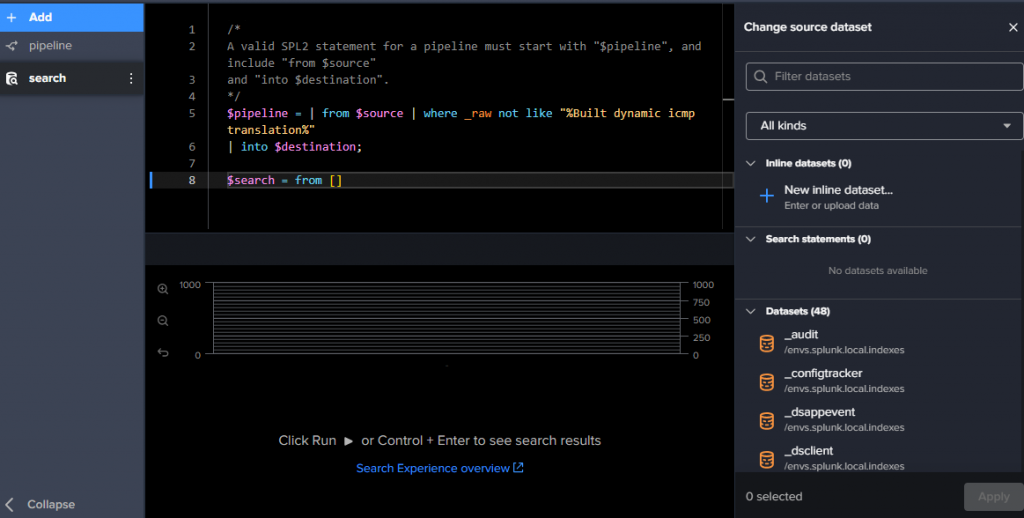
When dataset is selected, you can again do Actions, like setting fields, enriching with lookups, masking values in a field (_raw by default), extracting fields (or JSON fields)..
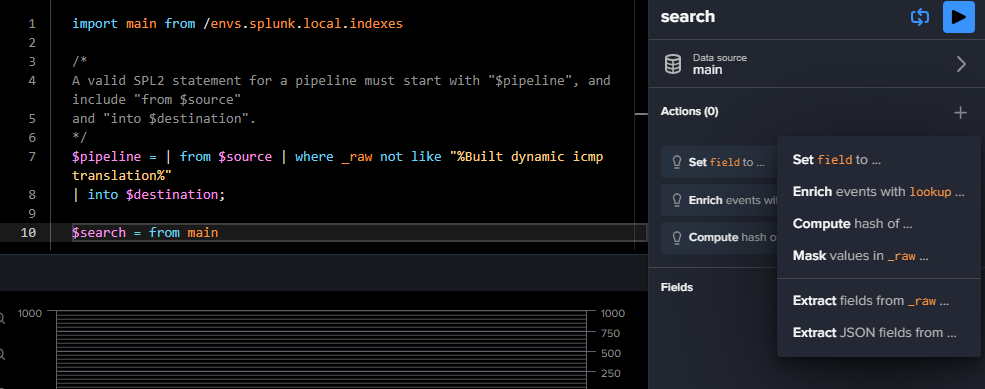
You then compose your pipeline from the GUI or you can modify it by typing SPL2 query.
Click on “Save pipeline” , it will automatically apply it to the edge instance. It can take some time, so the status of the pipeline then the status of the Edge Processors can be in purple color during that time. You can refresh the page to check if it is green again.
Testing/Validation
Once the pipeline is created and applied, you should receive the logs on the destination.
Configure/Verify Data Sources
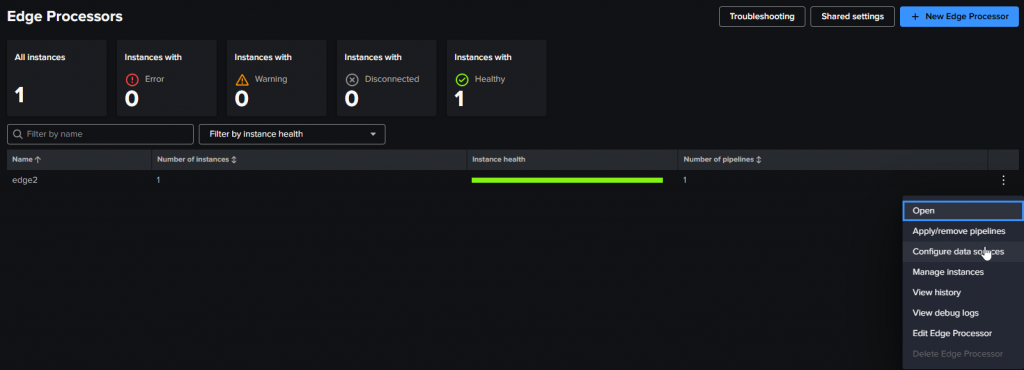
If not you can go to the Edge Processors menu on the left, then click on the Three points button at the end of the Edge instance and click the “Configure data sources” menu
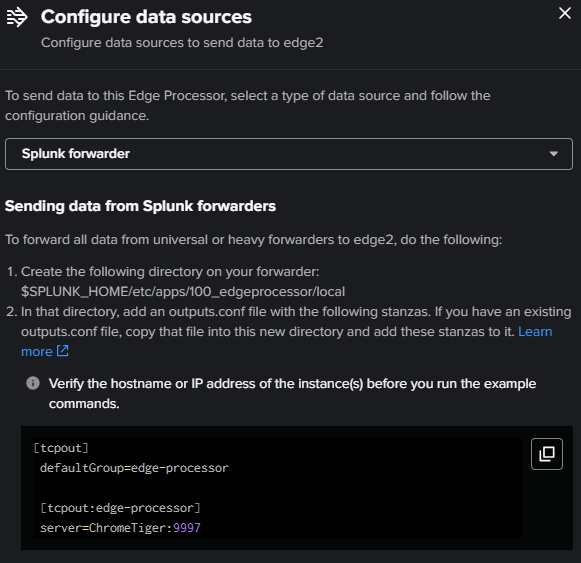
You choose the data source type (Splunk Forwarder, HEC or Syslog) to see what to/how to check the source.
For a Splunk Forwarder:
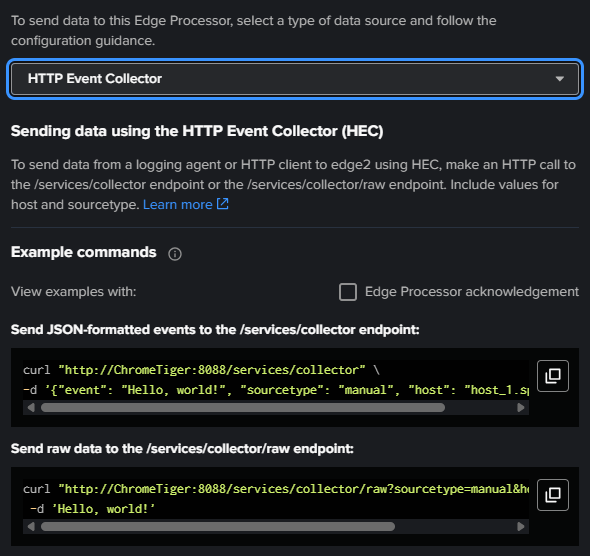
For a HEC :
For a Syslog:
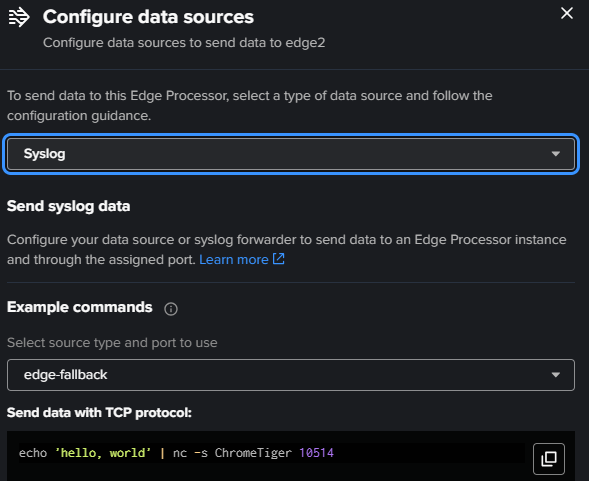
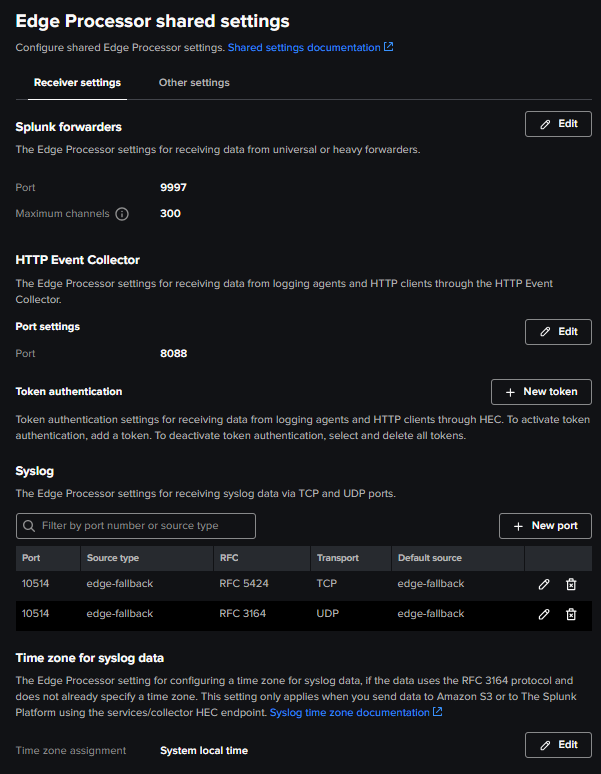
For Syslog, the listening port is 10514 (tcp AND udp) on the Edge instance. It can be changed in the Edge Processors page, in the Shared Settings, as well as the HEC port and Splunk forwarders port:
The test should be working, processing and sending the logs according to your pipeline setup.
Troubleshooting
All logs are sent to _internal with the edge-log sourcetype.
You can also find the edge-fallback sourcetype and source to see what was processed through the pipeline for syslog events.
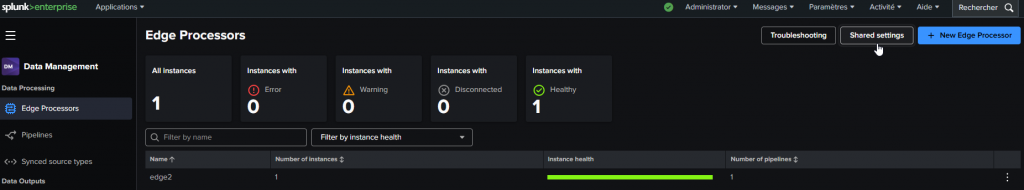
You can always refer to the Troubleshooting dashboard, accessible through the Edge Processor page.
Tips & Tricks
Be careful not to send the edge-log data to a specified index in a pipeline, the edge-log must remain in the _internal index, and accessible from the Data Management application, otherwise Troubleshooting queries and dahboards delivered by Splunk will not work
If you want to remove an Edge Processor, don’t forget to remove/unapply the attached pipelines first. Otherwise you will get orhpan pipelines, which can be hard to remove.
It can happen that the Token used for first time setup expires (5min TTL): you will then have to recreate one in the Splunk interface and replace the token value in the installation config script. It is detailed in the Troubleshooting page of Splunk Edge Processor, but worth noticing it if you encounter a Pending or Error status of your Edge instance for an abnormal long time.
Conclusion
I will be straightforward: the Edge Processor solution is a good idea but for now it is limited and not very flexible.
If you know Cribl a little, you know that the experience is smooth and flexible: you can get sample data from the live data flow, you can build your pipelines with advanced functions, the interface is clear, you have plenty of data sources that can be pipelined, and plenty of destination types.
Splunk Edge Processor is very limited in terms of sources and destinations.
Using SPL2 as query language if you don’t know it, is an additional difficulty. Thankfully, the UI helps you to create the pipelines. But to use the preview you can’t do it in real time with live data.
The fact that the Uninstall script does not appear until the instance is correctly seen from Splunk Data Management control plane can be a problem (I had the problem). In addition, the Data Management control plane should be the “deployer” of the Edge instances, because when you have a problem, manually change the token in the configuration file is…prehistoric ? In that way, Cribl is far better for agent management.
Now the Edge Processor solution is brand new and the whole feature will improve. Ingest Actions combined with Edge Processor will contribute to help you process data before ingestion, reducing the license cost, and all for free because these two features are included with Splunk.