Deploy to distributed deployment
Installation for distributed deployments
Distributed deployment matrix:
Software components:
Splunk roles |
metricator-for-nmon |
SA-metricator-for-nmon |
TA-metricator-* |
|---|---|---|---|
Search head |
X |
X (optional) |
|
Indexer |
X |
X (optional) |
|
Master node |
X (optional) |
||
Deployment server |
Conditional |
Conditional |
|
Heavy Forwarder |
Conditional |
Conditional |
|
Universal Forwarder |
X |
The Technology Add-ons provide metrics and configuration collection for the host than runs the add-on, which is optional.
The Support Add-on does not generate any collection, but defines indexes and contains index time configuration settings.
If running ITSI, the ITSI module must be deployed on all ITSI search heads:
Splunk roles |
DA-ITSI-METRICATOR-NMON |
|---|---|
ITSI Search head(s) |
X |
The following installation tutorial covers all aspects of a distributed deployment scenario:
Standalone indexers
Single site or multi-site indexer clustering
Standalone search heads
Search heads in a search head cluster (SHC)
The HEC version of the Technology Addon “TA-metricator-hec-nmon” requires extra steps of configuration (HEC configuration, nmon.conf configuration)
See: Deployment of the TA-metricator-hec-for-nmon
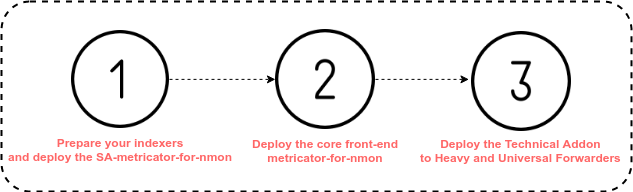
1. Preparing the indexer layer
1.1. Deploying on clustered indexers
We assume that your indexers are already configured and operational, in other words you are receiving data from any Universal or Heavy Forwarder configured to send data to your indexers.
Deploying the Support Add-on on clustered indexers
ALL THESE ACTIONS MUST BE DONE ON THE MASTER NODE
Please refer to Splunk official documentation for the management of cluster bundle: http://docs.splunk.com/Documentation/Splunk/latest/Indexer/Updatepeerconfigurations
Reminder:
If you don’t want to collect performance and configuration data from your indexers, only deploy the Support Add-on on the indexers layer.
If you want to collect performance and configuration data from your indexers, deploy both the Support Add-on and the Technology Add-on.
Support Add-on:
The Support Add-on tgz archive must be uncompressed and installed in the Master Node in $SPLUNK_HOME/etc/master_apps/ (where $SPLUNK_HOME refers to the root directory of your Splunk installation)
cd /opt/splunk/etc/master-apps
tar -xvzf /tmp/SA-metricator-for-nmon_*.tar.gz
Additional configuration parameters for your indexes:
Splunk does not allow third party applications to create custom indexes, without failing to be validated with appinspect.
Ideally create a local directory in the SA-metricator-for-nmon name space, and create the following indexes.conf:
Notes: If repFactor is set to auto at the global level (good practice), then it is not required in the indexes.conf file
# nmon data ingested as metrics
[os-unix-nmon-metrics]
disabled = false
coldPath = $SPLUNK_DB/os-unix-nmon-metrics/colddb
datatype = metric
homePath = $SPLUNK_DB/os-unix-nmon-metrics/db
splitByIndexKeys = metric_name,host
thawedPath = $SPLUNK_DB/os-unix-nmon-metrics/thaweddb
repFactor = auto

# nmon data ingested as regular events
[os-unix-nmon-events]
disabled = false
coldPath = $SPLUNK_DB/os-unix-nmon-events/colddb
homePath = $SPLUNK_DB/os-unix-nmon-events/db
thawedPath = $SPLUNK_DB/os-unix-nmon-events/thaweddb
repFactor = auto

# nmon config ingested as regular events
[os-unix-nmon-config]
disabled = false
coldPath = $SPLUNK_DB/os-unix-nmon-config/colddb
homePath = $SPLUNK_DB/os-unix-nmon-config/db
thawedPath = $SPLUNK_DB/os-unix-nmon-config/thaweddb
repFactor = auto

# nmon internal data
[os-unix-nmon-internal]
disabled = false
coldPath = $SPLUNK_DB/os-unix-nmon-internal/colddb
homePath = $SPLUNK_DB/os-unix-nmon-internal/db
thawedPath = $SPLUNK_DB/os-unix-nmon-internal/thaweddb
repFactor = auto
Splunk volumes:
The following example could be used if you have a “primary:volume” for hot and warm buckets, and a “secondary:volume” for cold buckets:
# nmon data ingested as metrics
[os-unix-nmon-metrics]
disabled = false
coldPath = volume:secondary/os-unix-nmon-metrics/colddb
datatype = metric
homePath = volume:primary/os-unix-nmon-metrics/db
splitByIndexKeys = metric_name,host
thawedPath = $SPLUNK_DB/os-unix-nmon-metrics/thaweddb
repFactor = auto

# nmon data ingested as regular events
[os-unix-nmon-events]
disabled = false
coldPath = volume:secondary/os-unix-nmon-events/colddb
homePath = volume:primary/os-unix-nmon-events/db
thawedPath = $SPLUNK_DB/os-unix-nmon-events/thaweddb
repFactor = auto

# nmon config ingested as regular events
[os-unix-nmon-config]
disabled = false
coldPath = volume:secondary/os-unix-nmon-config/colddb
homePath = volume:primary/os-unix-nmon-config/db
thawedPath = $SPLUNK_DB/os-unix-nmon-config/thaweddb
repFactor = auto

# nmon internal data
[os-unix-nmon-internal]
disabled = false
coldPath = volume:secondary/os-unix-nmon-internal/colddb
homePath = volume:primary/os-unix-nmon-internal/db
thawedPath = $SPLUNK_DB/os-unix-nmon-internal/thaweddb
repFactor = auto
This configuration will be part of the cluster bundle.
Technology Add-on on the master node for metric collection of the master node: (optional)
If you want to generate metrics and configuration collection for the master node itself:
The TA must be uncompressed and installed in the Master Node in $SPLUNK_HOME/etc/apps/ (where $SPLUNK_HOME refers to the root directory of your Splunk installation)
cd /opt/splunk/etc/apps
tar -xvzf /tmp/TA-metricator-*.tar.gz
Technology Add-on on the master node for metric collection of the indexers: (optional)
If you want to generate metrics and configuration collection for the indexers:
The Technology Add-on must be uncompressed and installed in the Master Node in $SPLUNK_HOME/etc/master-apps/ (where $SPLUNK_HOME refers to the root directory of your Splunk installation)
cd /opt/splunk/etc/master-apps
tar -xvzf /tmp/TA-metricator-*.tar.gz
Validate the cluster bundle:
You can use the following command to validate the state of the cluster bundle before its publication:
/opt/splunk/bin/splunk validate cluster-bundle --check-restart
Then check the bundle status:
/opt/splunk/bin/splunk show cluster-bundle-status
Publish the cluster bundle to indexers, what implies an automatic rolling restart of indexers:
/opt/splunk/bin/splunk apply cluster-bundle
To see the current status of the indexer cluster:
In CLI:
/opt/splunk/bin/splunk show cluster-bundle-status
In Splunk Web, connected to the master node console:
Settings –> Indexer Clustering
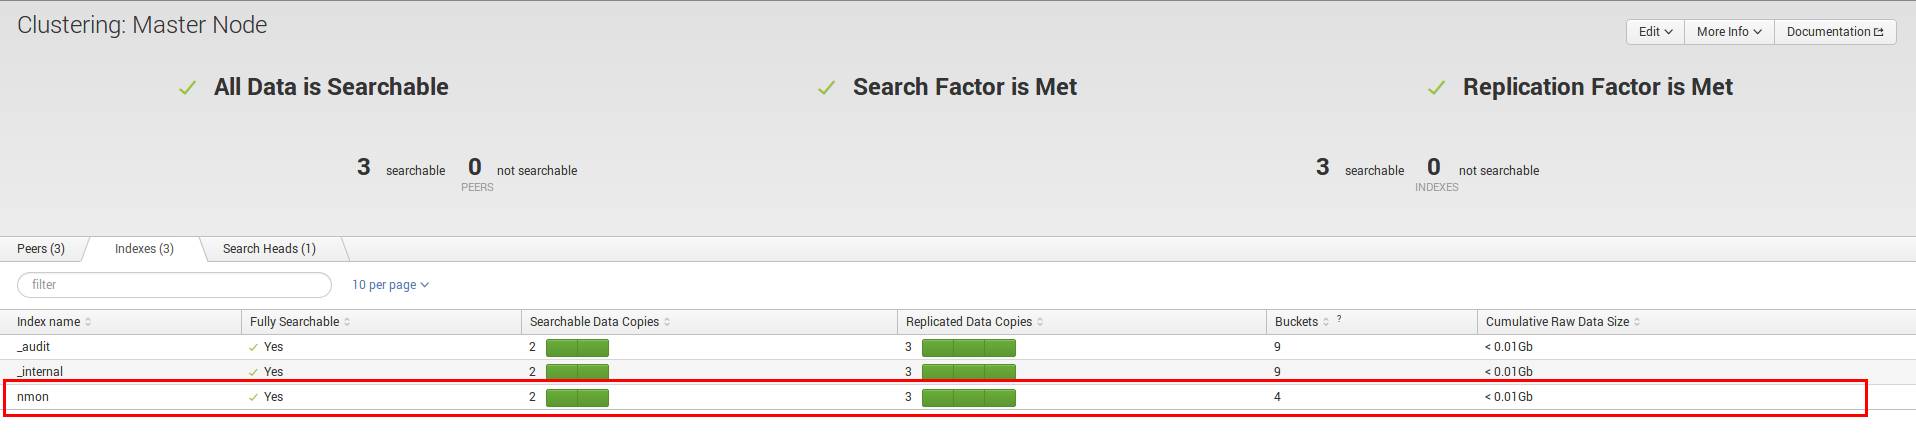
Upon Rolling Restart of the indexer cluster, and if the local data performance collecting is activated, a new clustered index will be available in the indexer clustering console from the Master node:
If you have deployed the Technology Add-on on the master node to collect metrics for the master node itself, restart Splunk:
Wait for the rolling restart of the indexers to be achieved before restarting the master node.
/opt/splunk/bin/splunk restart
1.2. Deploying the Support Add-on and Technology Add-on (optional) on standalone indexers
ALL THESE ACTIONS MUST BE DONE FOR EACH STANDALONE INDEXER
Remind:
If you don’t want to collect performance and configuration data from your indexers, deploy only the Support Add-on.
If you want to collect performance and configuration data from your indexers, deploy both the Support Add-on and the Technology Add-on.
Upload the tgz archives on your master node in a temporary directory, for instance:
cd /tmp/
<upload the archive here>
Support Add-on:
The Support Add-on tgz archive must be uncompressed and installed in the Master Node in $SPLUNK_HOME/etc/master_apps/ (where $SPLUNK_HOME refers to the root directory of your Splunk installation)
cd /opt/splunk/etc/apps
tar -xvzf /tmp/SA-metricator-*.tar.gz
If you need any customizations of the indexes, please see the previous section for clustered indexers.
Technology Add-on on the indexers for metric collection: (optional)
If you want to generate metrics and configuration collection for the indexers:
The Technology Add-on must be uncompressed and installed in $SPLUNK_HOME/etc/apps/ (where $SPLUNK_HOME refers to the root directory of your Splunk installation)
cd /opt/splunk/etc/apps
tar -xvzf /tmp/TA-metricator-*.tar.gz
Restart the indexers:
/opt/splunk/bin/splunk restart
2. Deploying the front-end application and Technology Add-on (optional) to search heads
2.1. Deploying the front-end application in a Search Head Cluster
ALL THESE ACTIONS MUST BE DONE ON THE SHC DEPLOYER
Upload the metricator-for-nmon front-end tgz archive to the search head in a temporary directory, example:
cd /tmp/
<upload archive here>
NOTE: For more information about search head clustering and application deployment, see:
http://docs.splunk.com/Documentation/Splunk/latest/DistSearch/PropagateSHCconfigurationchanges
On the SHC deployer, the configuration bundle resides under the $SPLUNK_HOME/etc/shcluster directory. The set of files under that directory constitutes the configuration bundle.
The directory has this structure:
$SPLUNK_HOME/etc/shcluster/
     apps/
          <app-name>/
          <app-name>/
          ...
     users/
Extract the content of the core application into the “apps” directory:
cd /opt/splunk/etc/shcluster/apps/
tar -xvf /tmp/metricator-*.tgz
If you want to generate nmon metrics and configuration data, extract the content of the Technology Add-on archive:
cd /opt/splunk/etc/shcluster/apps/
tar -xvf /tmp/TA-metricator-*.tgz
Finally push the configuration bundle to publish the Nmon core application to all search heads:
/opt/splunk/bin/splunk apply shcluster-bundle -target <URI>:<management_port> -auth <username>:<password>
Where <URI>:<management_port> targets any of the search head members, example:
/opt/splunk/bin/splunk apply shcluster-bundle -target https://search-head1:8089 -auth <username>:<password>
The publication of the search head cluster bundle will automatically generate a rolling restart of the members. Once the rolling restart is terminated, the application will be available.
2.2. Deploying the front-end application in a standalone search head
For each search head where you want to deploy the front-end application:
Upload the archive to the search head in a temporary directory, example:
cd /tmp/
<upload archive here>
Uncompress the content of the tar.gz archive in $SPLUNK_HOME/etc/apps/ (where $SPLUNK_HOME refers to the Application root directory)
cd /opt/splunk/etc/apps/
tar -xvzf metricator-*.tgz
If you want to collect metrics and inventory data from the search head, deploy the Technology Add-on:
cd /opt/splunk/etc/apps/
tar -xvf /tmp/TA-metricator-*.tgz
Restart each search head manually:
splunk restart
3. Deploying the Technology Add-on to Heavy or Universal Forwarders
The next step is to deploy the Technology Add-on in every machine that is a target to be monitored.
The following tutorial assumes that you will be using the Splunk Deployment Server to publish the TA package to your servers.
However, any other automation solution (Ansible, Chef, Puppet…) could as well be used with no issue.
3.1 Preparing the Technology Add-on on Deployment Servers
ALL THESE ACTIONS MUST BE DONE ON INSTANCE(S) ACTING AS DEPLOYMENT SERVERS
Upload the archive to a temporary directory, example:
cd /tmp/
<upload archive here>
Uncompress the content of the tar.gz archive in $SPLUNK_HOME/etc/deployment-apps/ (where $SPLUNK_HOME refers to the Application root directory)
cd /opt/splunk/etc/deployment-apps/
tar -xvzf /tmp/TA-metricator-*.tgz
If you want to collect metrics and inventory data from the Deployment Server, deploy the Technology Add-on:
cd /opt/splunk/etc/apps/
tar -xvf /tmp/TA-metricator-*.tgz
Splunk must be restarted if you deployed the Technology Add-on through the Deployment Server.
3.2. Configuring the deployment server to push the Technology Add-on to Forwarders
We assume that your Universal or Heavy Forwarders are properly configured to be connected to your Deployment Servers.
If you are new to Splunk consult: http://docs.splunk.com/Documentation/Splunk/latest/Forwarding/Setupforwardingandreceiving
ALL THESE ACTIONS MUST BE DONE ON INSTANCE(S) ACTING AS DEPLOYMENT SERVERS IN SPLUNK WEB
Connect to Splunk Web of your Deployment Server
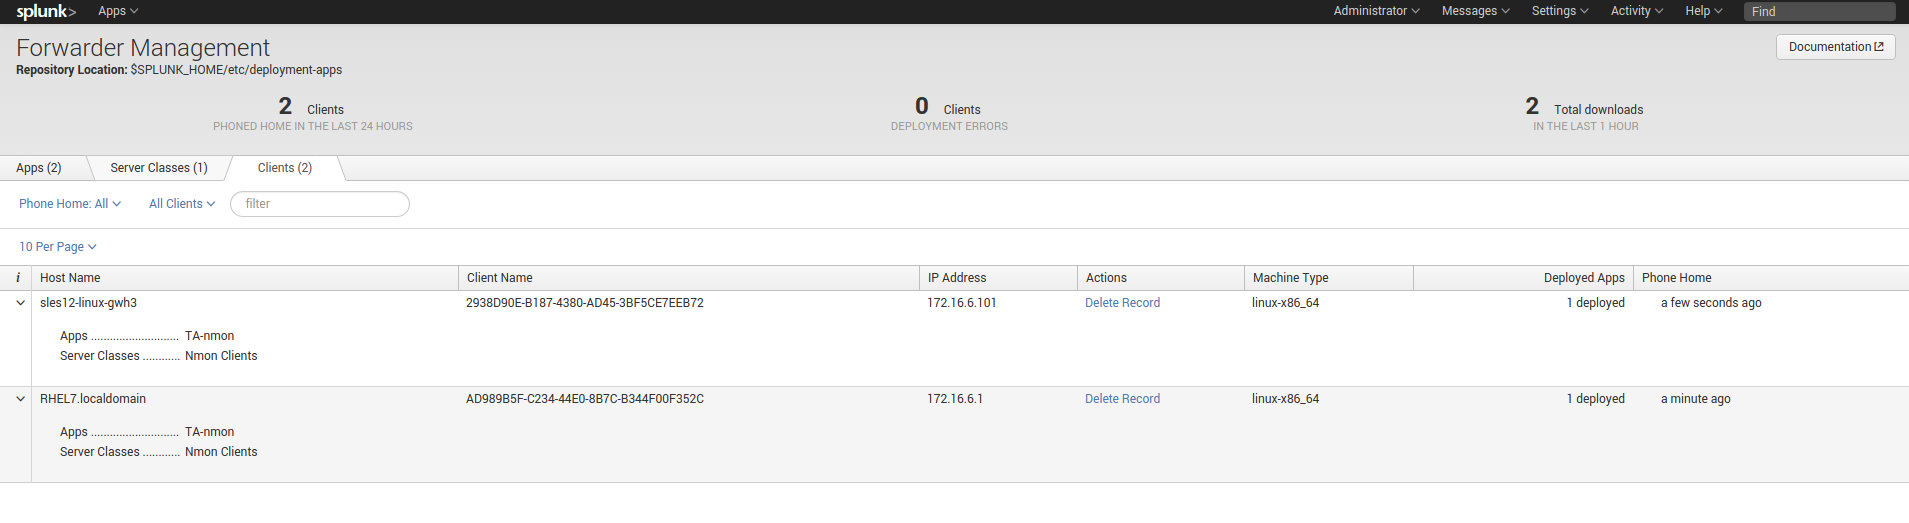
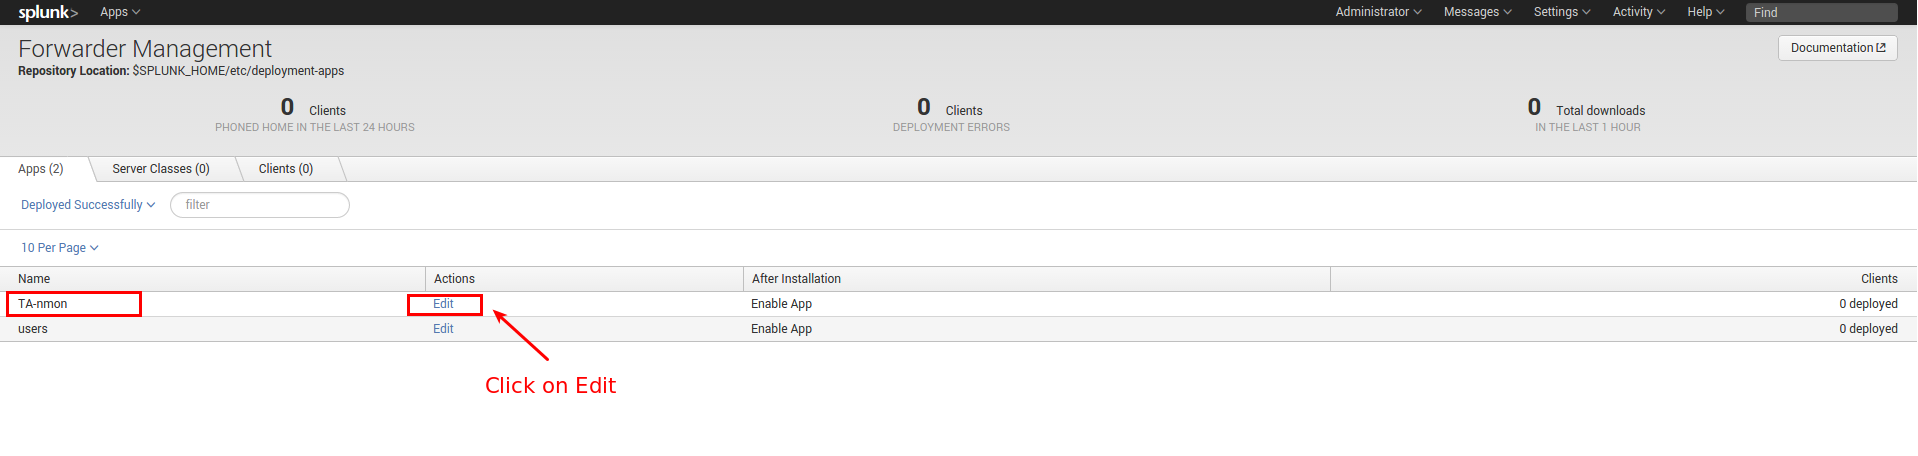
Access the Forwarder Management Interface (Settings —> Forwarder Management)
Follow these steps examples to set up a server class that will push to clients the TA package
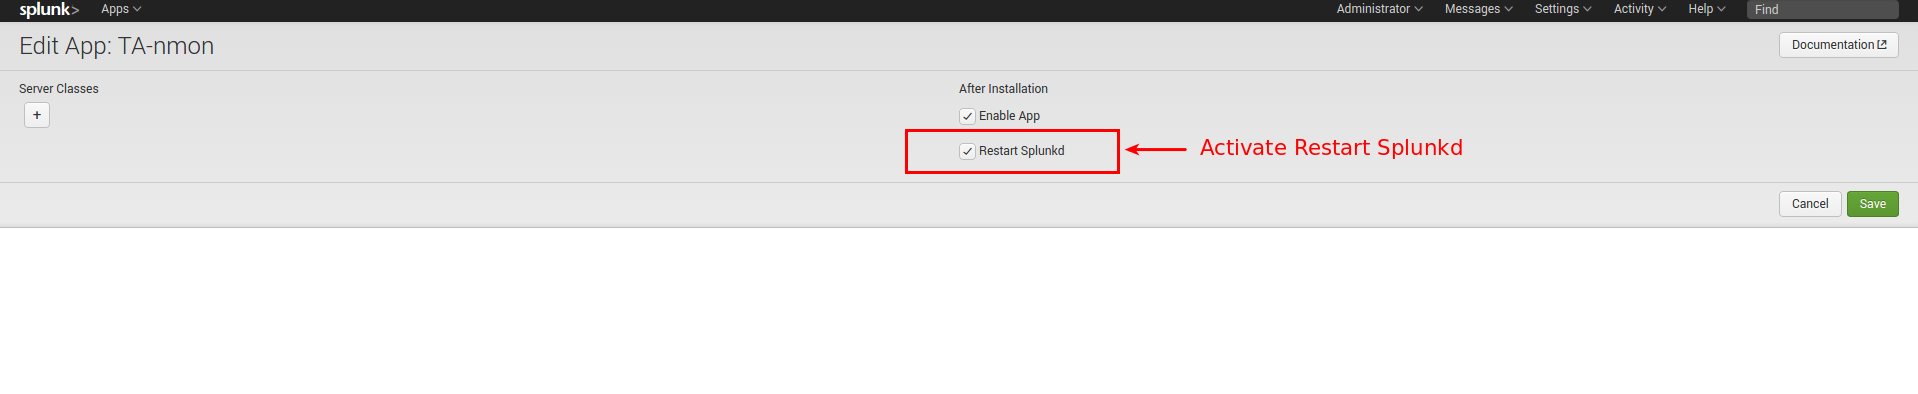
Edit the Technology Add-on application:
Ensure to activate “restart splunkd”:
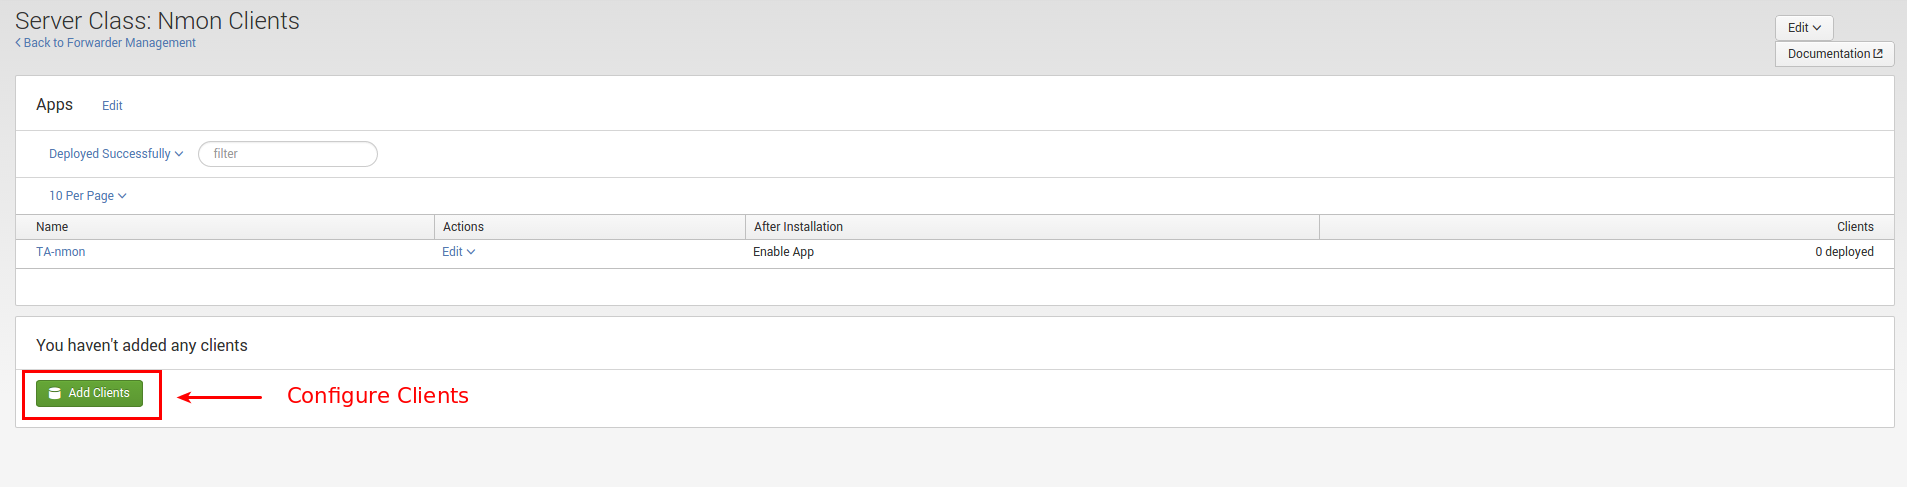
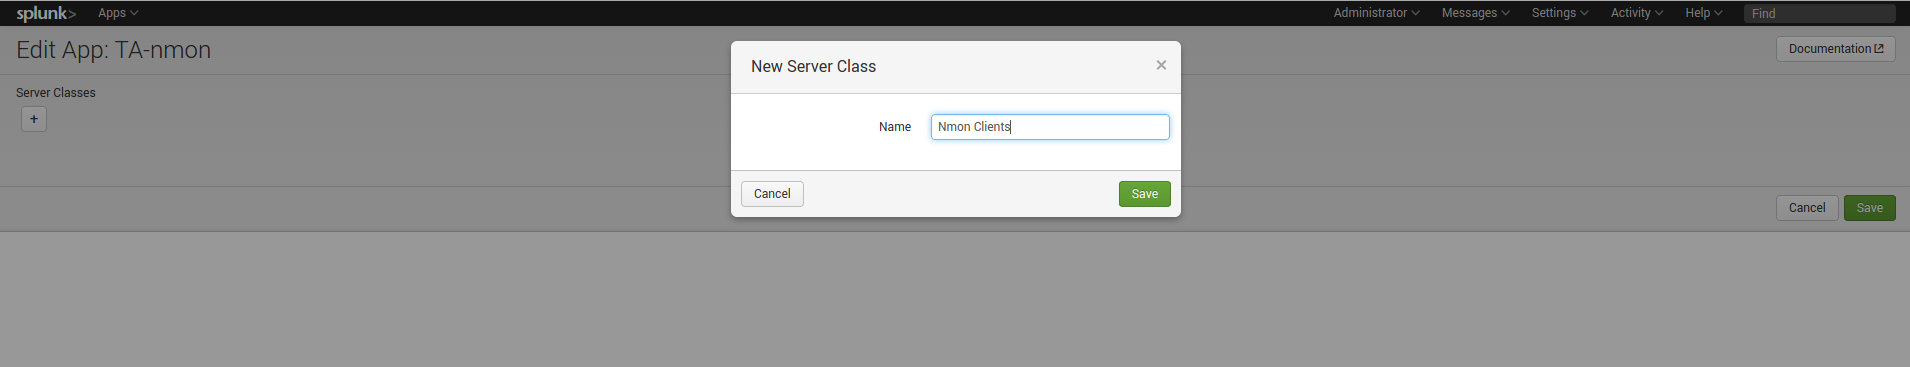
Create a new server class:
Associate the Technology Add-on with the server class:
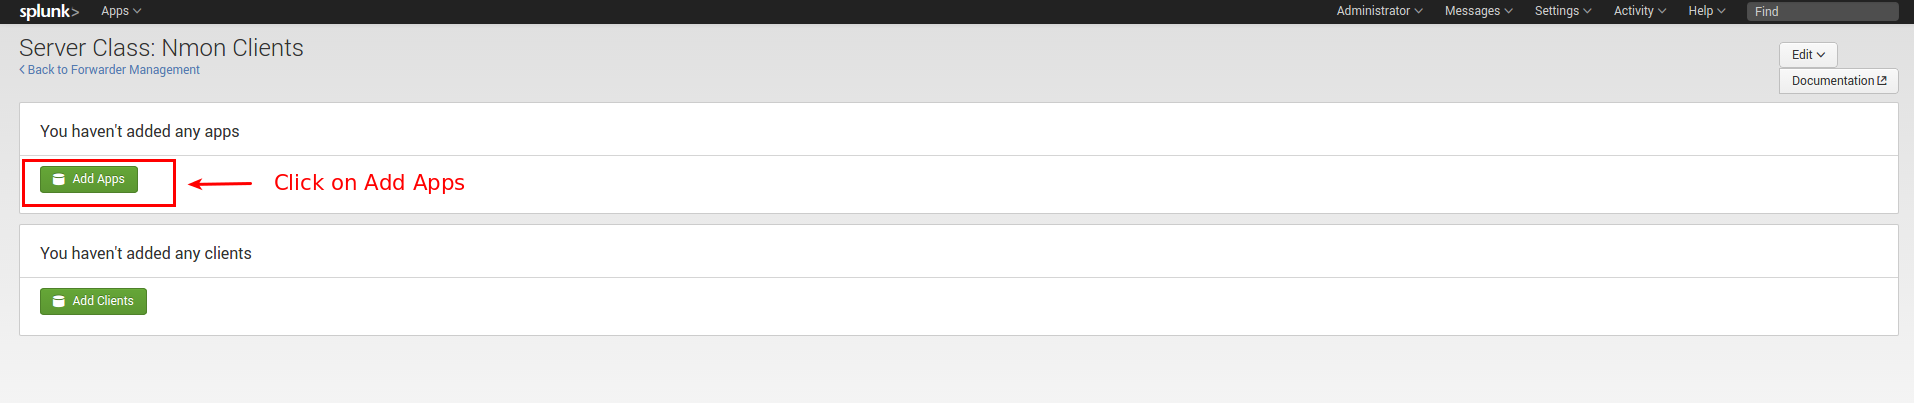
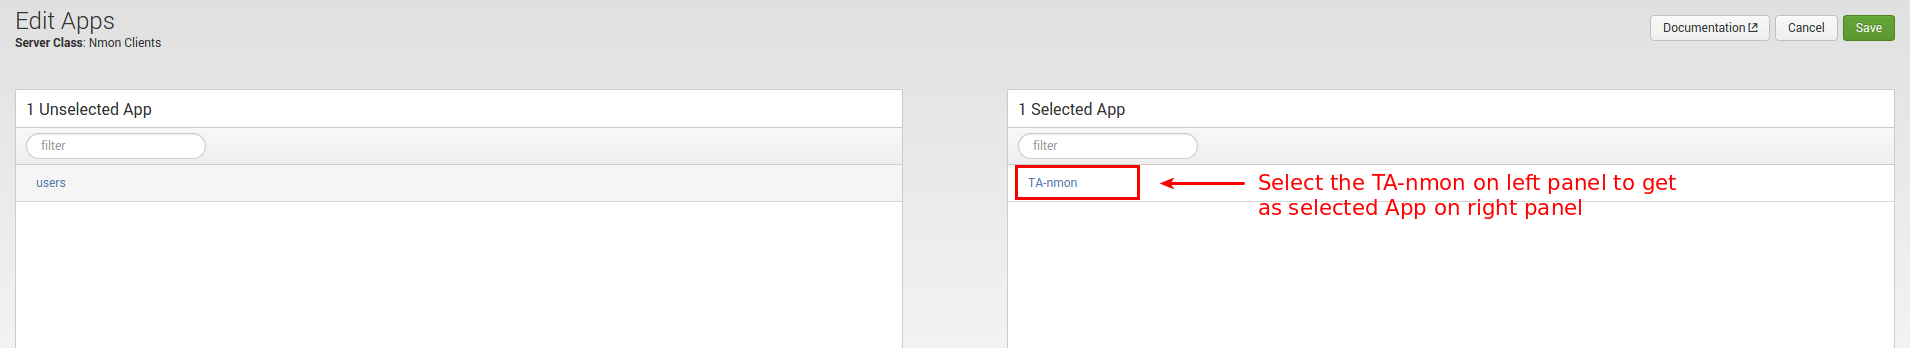
And finally add required clients: