Deployment of the TA-metricator-hec-for-nmon
Requirements
Operating system
The Technology Add-on is compatible with:
Linux OS X86 in 32/64 bits, PowerPC (PowerLinux), s390x (ZLinux), ARM
IBM AIX 7.1 and 7.2
Oracle Solaris 11
Third party software and libraries
To operate as expected, the Technology Add-on requires a Python or a Perl environment available on the server:
Python environment: used in priority
Hint
Python 3 support
From the release 1.1.0 of the Add-ons, Python 3.x is required (unless using Perl)
The last release supporting Python 2.x is the release 1.0.11
Requirement |
Version |
|---|---|
Python interpreter |
3.x |
Perl environment: used only in fallback
Requirement |
Version |
|---|---|
Perl interpreter |
5.x |
Time::HiRes module |
any |
Text::CSV or Text::CSV_XS module |
any |
Notes:
IBM AIX does not generally contain Python. Nevertheless, Perl is available as a standard and the Technical Add-on has the Perl “Text::CSV” module built-in. More, Time::HiRes is part of Perl core modules.
Modern Linux distribution generally have Python version 2.7.x available and do not require any further action.
Linux distributions lacking Python will fallback to Perl and must satisfy the Perl modules requirements.
If running on a full Splunk instance (any Splunk dedicated machine running Splunk Enterprise), the Technical Add-on uses Splunk built-in Python interpreter.
As well, the servers need to have curl available:
Requirement |
Version |
|---|---|
curl |
any |
Deployment
The TA-metricator-for-nmon-hec can be deployed to any full Splunk instance or Universal Forwarder instances.
The technical Add-on should be deployed to the regular Splunk directory for application:
$SPLUNK_HOME/etc/apps
where $SPLUNK_HOME refers to the root directory of the Splunk installation
The Technology Add-on uses relative paths referring to $SPLUNK_HOME, as such it is fully compatible with any deployment where $SPLUNK_HOME refers to a custom directory for your installation.
Deployment by Splunk deployment server
The TA-metricator-hec-for-nmon can be deployed by any Splunk deployment server:
Upload the tgz archive on your deployment server in a temporary directory, example:
cd /tmp/
<upload the archive here>
The Support Add-on tgz archive must be uncompressed and installed in $SPLUNK_HOME/etc/deployment-server:
cd /opt/splunk/etc/deployment-server/
tar -xvzf /tmp/TA-metricator-for-nmon_*.tar.gz
If you have any customization required, create a local directory and configure your settings in local/ configuration files.
Finally, create a serverclass or add the TA-metricator-hec-for-nmon application into existing serverclass, required parameters are:
Enable App
Restart Splunkd
There are no additional configuration actions required, the monitoring inputs are activated by default and the Technical Add-on will start as soon as it is deployed and splunkd has been restarted
Deployment by any configuration management solution
The Technology Add-on can be deployed by any configuration management product such as Ansible, Chef or Pupet.
Steps are the same than for a deployment by Splunk deployment server and the configuration management solution must ensure to issue a proper restart of the Splunk instance after the Technical Add-on deployment.
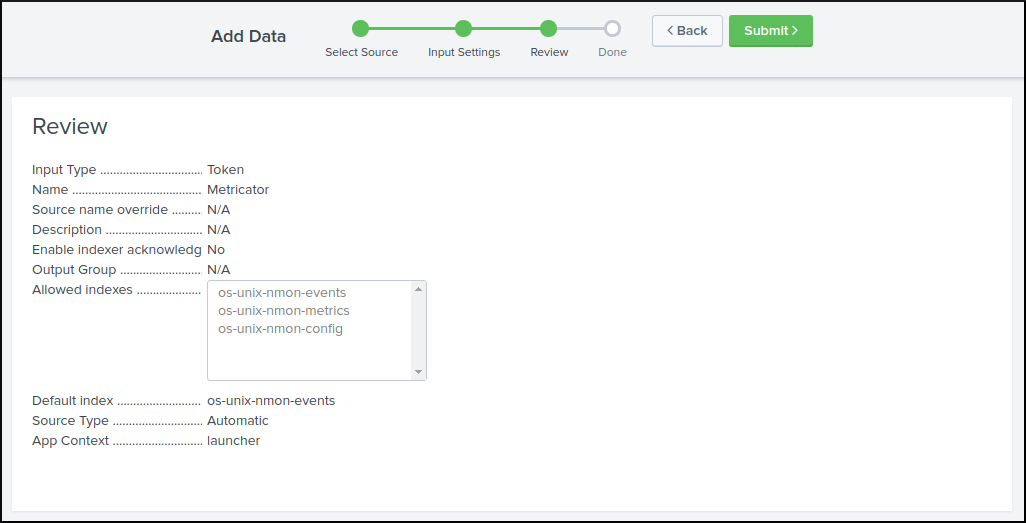
Configuration of the Splunk HTTP Event Collector
The TA-metricator-for-nmon relies on the Splunk HTTP Event Collector to forward metrics, nmon data events and configuration data.
To achieve this, you need to have the HEC input being activated, and a token mist be created.
Requirements are:
Source name override: Optional
Sourcetype: Automatic
Indexes allowed: os-unix-nmon-events, os-unix-nmon-metrics, os-unix-nmon-config
Default index: os-unix-nmon-events (unused, could be any of the indexes)
In Addition with the global configuration that activates the HEC service, this result in a configuration to be stored into an “inputs.conf” configuration file, such as:
[http://<input_name>]
disabled = 0
index = os-unix-nmon-events
indexes = os-unix-nmon-config,os-unix-nmon-events,os-unix-nmon-metrics
token = <token_value>
Take note of the protocol (http versus https) and the value of the token, and configure the TA:
Create a local directory in TA-metricator-hec-for-nmon
Copy default/nmon.conf to local/nmon.conf
Edit the nmonparser options and ensure to configure the Splunk HEC endpoint URL and the value of your token:
nmonparser_options="--mode fifo --use_fqdn --silent --no_local_log --splunk_http_url https://splunk.mydomain.com:8088/services/collector/event --splunk_http_token insert_your_splunk_http_token --splunk_metrics_index os-unix-nmon-metrics --splunk_events_index os-unix-nmon-events --splunk_config_index os-unix-nmon-config"
What happens once the Technology Add-on has been deployed
Once the technical Add-on has been deployed, and the Splunk instance restarted, the following actions are taken automatically:
Fifo reader processes and Nmon processes startup
At startup time, Splunk will automatically trigger the execution of the “bin/metricator_helper.sh” script.
This script does several actions, such as:
Identifying the operating system and its sub-version
For Linux OS, locally extracting the “bin/linux.tgz” archive if existing and if first deployment/upgrade
starting the fifo_reader processes
starting the nmon binary according to the guest Operating System and configuration settings
The script activity is available in:
standard output:
eventtype=nmon:collect host=<server hostname>
error output:
index=_internal sourcetype=splunkd host=<server hostname> error metricator_helper.sh
Running processes in machine
Several processes can be found in machine, at initial run you will find fifo_reader processes (output might differ specially for paths):
Using Python interpreter: (Universal Forwarder example)
python /opt/splunkforwarder/etc/apps/TA-metricator-for-nmon/bin/metricator_reader.py --fifo fifo1
/bin/sh -c /opt/splunkforwarder/etc/apps/TA-metricator-for-nmon/bin/metricator_reader.sh /opt/splunkforwarder/var/log/metricator/var/nmon_repository/fifo1/nmon.fifo
/bin/sh /opt/splunkforwarder/etc/apps/TA-metricator-for-nmon/bin/metricator_reader.sh /opt/splunkforwarder/var/log/metricator/var/nmon_repository/fifo1/nmon.fifo
Using Perl interpreter: (Universal Forwarder example)
/usr/bin/perl /opt/splunkforwarder/etc/apps/TA-metricator-for-nmon/bin/metricator_reader.pl --fifo fifo1
/bin/sh /opt/splunkforwarder/etc/apps/TA-metricator-for-nmon/bin/metricator_reader.sh /opt/splunkforwarder/var/log/metricator/var/nmon_repository/fifo1/nmon.fifo
The startup operation will be visible by a message logged:
eventtype=nmon:collect starting fifo_reader
Example:
12-02-2018 05:12:14, sys-91371.dal-ebis.ihost.com INFO: starting the fifo_reader fifo1
In addition, you will find an nmon binary instance running, example: (output will differ depending on operating systems and settings)
/opt/splunkforwarder/var/log/metricator/bin/linux/rhel/nmon_power_64_rhel6_be -F /opt/splunkforwarder/var/log/metricator/var/nmon_repository/fifo1/nmon.fifo -T -s 60 -c 1440 -d 1500 -g auto -D -p
The startup operation will be visible by a message logged:
eventtype=nmon:collect starting nmon
Example:
12-02-2018 05:12:15, sys-91371.dal-ebis.ihost.com INFO: starting nmon : /opt/splunkforwarder/var/log/metricator/bin/linux/sles/nmon_power_64_sles12_le -F /opt/splunkforwarder/var/log/metricator/var/nmon_repository/fifo1/nmon.fifo -T -s 60 -c 1440 -d 1500 -g auto -D -p in /opt/splunkforwarder/var/log/metricator/var/nmon_repository/fifo1
Nmon data processing
The Nmon data processing is achieved every minute by the script “metricator_consumer.sh”
Its activity is indexed in Splunk, and available via the following search:
eventtype=nmon:processing host=<server hostname>
Example:
12-02-2018 09:50:02 Reading NMON data: 440 lines 26766 bytes
Splunk Root Directory ($SPLUNK_HOME): /opt/splunkforwarder
Add-on type: /opt/splunkforwarder/etc/apps/TA-metricator-for-nmon
Add-on version: 1.0.0
nmonparser version: 2.0.0
Guest Operating System: linux
Python version: 2.7.5
HOSTNAME: sys-91367.dal-ebis.ihost.com
NMON VERSION: 16f
TIME of Nmon Data: 05:11.54
DATE of Nmon data: 12-FEB-2018
INTERVAL: 60
SNAPSHOTS: 1440
logical_cpus: 1
NMON OStype: Linux
virtual_cpus: 1
SerialNumber: PPD-Linux
NMON ID: 12-FEB-2018:05:11.54,sys-91367.dal-ebis.ihost.com,PPD-Linux,26766,1518430314,1518446953
ANALYSIS: Enforcing fifo mode using --mode option
Starting_epochtime: 1518430314
Ending_epochtime: 1518446953
last known epoch time: 0
CONFIG section: will not be extracted (time delta of 66282 seconds is inferior to 86400 seconds)
Output mode is configured to run in minimal mode using the --silent option
Elapsed time was: 0.188985 seconds
Splunk indexing
Unlike the TA-metricator-for-nmon, the HEC version directly streams the metrics and data to Splunk using the HEC endpoint.
This operation happens transparently and silently during the execution of the nmonparser_hec.py | nmonparser_hec.pl scripts.
In case of issue, please refer to the official documentation: http://docs.splunk.com/Documentation/Splunk/7.1.0/Data/HECWalkthrough
You can achieve a manual test using the curl command such as:
curl -k https://<host>:8088/services/collector -H 'Authorization: Splunk <token>' -d '{"sourcetype": "mysourcetype", "event":"Hello, World!"}'
The nmonparser_hec scripts use exactly the same behavior to forward data to the HEC endpoint.