Metrics collection management
The metric collection is managed by the nmon.conf configuration file, it can be used to easily customize several options related to the application behaviours and specially the collection management.
nmon.conf precedence
There are 3 different locations that can be used to achieve buil-tin customization of the Technical Add-on:
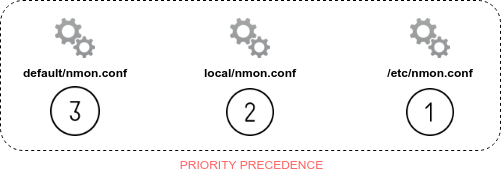
TA-metricator/default/nmon.conf
This is the builtin configuration settings used to define default settings.
Parameters set in the default/nmon.conf are loaded before any other configuration, and should never be modified because any changes would not persist through app upgrades.
TA-metricator/local/nmon.conf
The creation a local/nmon.conf allows you to configure settings that will be applied for any server receiving the deployment the Technical Add-on.
This configuration file if it exits will be loaded after the default/nmon.conf, any parameter set in it will override the default setting.
/etc/nmon.conf
If existing on the server, an /etc/nmon.conf configuration allows overriding settings on a per server basis.
This configuration file has the highest precedence, and will override any setting defined in default and local directories.
nmon.conf main settings
metrics collection interval and snapshots
The time in seconds between metric measures and the life cycle of an Nmon binary process are driven by the following 2 settings:
# value for interval: time in seconds between 2 performance measures
fifo_interval="60"

# value for snapshot: number of measure to perform
fifo_snapshot="1440"
Which means:
60 seconds between each performance metrics measures
24 hours of process life cycle
These are the recommended settings for most setup, but you can customize these settings for various purposes such as decreasing the number of metrics generated by day and influence licensing and storage costs.
The binaries lifecycle should always be 24 hours and should be modified according to the interval value.
NOTES:
If the interval value is set to value which is higher than the default 1 minute value, it is recommended to update the macro “nmon_span”.
This macro is used in dashboard to preset the most accurate value for time span during chart generation, and it contains a conditional field called “spanrestricted” which should be customized to this value.
Create a local copy of the macro and perform the customization.
nmon binaries parallel run
By default, every 24 hours a new nmon process is started automatically by Splunk.
In fact, the new processes will be started a few minutes earlier to avoid gaps between the collections, this feature is driven by the following setting:
# Time in seconds of margin before running a new iteration of Nmon process to prevent data gaps between 2 iterations of Nmon
# the metricator_helper.sh script will spawn a new Nmon process when the age in seconds of the current process gets higher than this value

# The endtime is evaluated the following way:
# endtime=$(( ${interval} * ${snapshot} - ${endtime_margin} ))

# When the endtime gets higher than the endtime_margin, a new Nmon process will be spawned
# default value to 240 seconds which will start a new process 4 minutes before the current process ends

# Setting this value to "0" will totally disable this feature

endtime_margin="240"
This feature can be totally disabled or customized to a lower or higher value depending on your needs.
If you observe gaps between 2 collections, you can increase this value. Most likely this would mean that Nmon needs more time to be able to collect various inventory information.
The default value should be adequate for most cases.
Network File-Systems collection (NFS)
The NFS metrics collection is not activated by default for AIX and Linux OS, the activation is driven by the following settings:
### NFS OPTIONS ###

# Change to "1" to activate NFS V2 / V3 (option -N) for AIX hosts
AIX_NFS23="0"

# Change to "1" to activate NFS V4 (option -NN) for AIX hosts
AIX_NFS4="0"

# Change to "1" to activate NFS V2 / V3 / V4 (option -N) for Linux hosts
# Note: Some versions of Nmon introduced a bug that makes Nmon to core when activating NFS. Please ensure your version is not outdated.
Linux_NFS="0"
Linux embedded binaries priority
The Technical Add-on contains pre-compiled binaries for various flavors of Linux distributions and architectures.
By default, the Technical Add-on will give priority to the embedded binaries versus any binary available in PATH of the guest server.
This setting is driven by:
# Change the priority applied while looking at nmon binary
# by default, the metricator_helper.sh script will use any nmon binary found in PATH
# Set to "1" to give the priority to embedded nmon binaries
# Note: Since release 1.6.07, priority is given by default to embedded binaries
Linux_embedded_nmon_priority="1"
If you decide to manage your own binaries on your system, or if you do want the Technical Add-on to use your own binaries if available on the guest server, then turn off this feature.
Linux processes capture (TOP collection)
By default on Linux Operating Systems, the technical Add-on will capture most resources consuming processes, which is known as the “TOP” collection.
This setting is driven by:
# Change the limit for processes and disks capture of nmon for Linux
# In default configuration, nmon will capture most of the process table by capturing main consuming processes
# This function is percentage limit of CPU time, with a default limit of 0.01
# Changing this value can influence the volume of data to be generated, and the associated CPU overhead for that data to be parsed

# Possible values are:
# Linux_unlimited_capture="0" --> Default nmon behavior, capture main processes (no -I option)
# Linux_unlimited_capture="-1" --> Set the capture mode to unlimited (-I -1)
# Linux_unlimited_capture="x.xx" --> Set the percentage limit to a custom value, ex: "0.01" will set "-I 0.01"
Linux_unlimited_capture="0"
There different configuration possible, such as asking Nmon to capture the full processes table (which generates more metrics and volumes) and or a specific CPU overhead percentage.
Linux disks devices
By default the Technical Add-on will capture the 1500 first disks devices, this number can be decreased or increased up to 3000 devices:
# Set the maximum number of devices collected by Nmon, default is set to 1500 devices
# This option will be ignored if you set the Linux_unlimited_capturation below.
# Increase this value if you have systems with more devices
# Up to 3000 devices will be taken in charge by the Application (hard limit in nmonparser)
Linux_devices="1500"
Linux disk groups (DG)
On Linux Operating Systems, Nmon will generate disk groups collections that manage properly disk related metrics aggregated by disk.
This feature is driven by:
# Enable disks extended statistics (DG*)
# Default is true, which activates and generates DG statistics
Linux_disk_dg_enable="1"

# Name of the User Defined Disk Groups file, "auto" generates this for you
Linux_disk_dg_group="auto"
Solaris VxVM I/O collection
On Solaris Operating System, you can activate VxVM I/O collection, driven by:
# Change to "1" to activate VxVM volumes IO statistics
Solaris_VxVM="0"
Solaris UARG collection
On Solaris Operating System, you can manage UARG collection (processes arguments), driven by:
# UARG collection (new in Version 1.11), Change to "0" to deactivate, "1" to activate (default is activate)
Solaris_UARG="1"
AIX startup options
For AIX Operating Systems, you can manage litteraly the whole Nmon startup options at once, driven by:
### AIX COMMON OPTIONS ###

# CAUTION: Since release 1.3.0, we use fifo files, which requires the option "-yoverwrite=1"

# Change this line if you add or remove common options for AIX, do not change NFS options here (see NFS options)
# the -p option is mandatory as it is used at launch time to save instance pid
AIX_options="-T -A -d -K -L -M -P -^ -p -yoverwrite=1"

# enable this line if you want to get only active disks
# AIX_options=""-T -A -d -K -L -M -P -^ -p -k `lspv|grep active|awk '{print $1","}'|tr -d '\040\011\012\015'` -yoverwrite=1"
Hostname override options
The Technical Add-on can be managed to override the server hostname values based on the value defined by Splunk.
This value is defined automatically at the first startup of Splunk in the following configuration file:
$SPLUNK_HOME/etc/system/local/inputs.conf
This feature is driven by:
######################
# hostname definition:
######################

# This option can be used to force the technical add-on to use the Splunk configured value of the server hostname
# If for some reason, you need to use the Splunk host value instead of the system real hostname value, set this value to "1"

# We will search for the value of host=<value> in $SPLUNK_HOME/etc/system/local/inputs.conf
# If no value is found, or if the file does not exist, we will fallback to the normal behavior

# Default is use system hostname

# FQDN management in nmonparser: The --fqdn option is not compatible with the host name override, if the override_sys_hostname
# is activated, the --fqdn argument will have no effect

override_sys_hostname="0"
If you activate this option and no hostname could be successfully extracted from the Splunk configuration file, the Technical Add-on will automatically revert to the server guest value.
This option cannot be used in conjunction with the Fully Qualified Domain Name override option that can be set in the nmonparser_options command line.
To be used this option requires customization of the nmonparser_options setting as the option “–use_fqdn” is set by default.
FrameID definition
The Technical Add-on provides an option to override the serial number option which is automatically used by the application to define the frameID value.
This feature is driven by:
#####################
# frameID definition:
#####################

# The frameID definition is an enrichment mechanism used within the application to associate a given host with a given frame identifier
# By default, the mapping is operated against the value of "serialnum" which is defined at the raw level by nmon binaries

# On AIX systems, the serialnum value is equal to the serial number of the frame hosting the partition
# On Linux and Solaris systems, the serialnum is equal to the value of the hostname

# Using this option allows you to override the serialnum value by a static value defined in the nmon.conf configuration file
# nmon.conf precedence allows defining the serialnum value on per deployment basis (local/nmon.conf) or on a per server basis (/etc/nmon.conf)

# default is:
# override_sys_serialnum="0"
# which lets nmon set the serialnum value

# Set this value to:
# override_sys_serialnum="1"
# to activate the serialnum override based on the value defined in:

# override_sys_serialnum_value="<sting>"
# Acceptable values for <string> are letters (lower and upper case), numbers and "-" / "_"

override_sys_serialnum="0"
override_sys_serialnum_value="none"
The FrameID (aka. serial number) can be defined statically, or dynamically using pre-action scripts in conjunction with this feature.
Nmon external metrics
The Technical Add-on contains several external metrics collections that are not natively parts of the collection made by the Nmon binary itself.
By default, these collections are:
UPTIME: output of the uptime command (system uptime, number of Unix users connected and load averages)
PROCCOUNT: number of running processes
DF_STORAGE: output of the df command in POSIX mode (file-systems usage)
DF_INODES: output of the df command in POSIX mode (file-systems inode usage)
The collection can be increased with your own external metrics, or this feature can totally be disabled driven by:
########################
# nmon external metrics:
########################

# nmon external generation management

# This option will manage the activation or deactivation of the nmon external data generation at the lower level, before it comes to parsers
# default is activated (value=1), set to "0" to deactivate

nmon_external_generation="1"
External metrics collections are defined in the default/nmonparser_config.json which can be customised with your own copy.
nmonparser options
The nmonparser options can be customized using the following settings:
#######################
# nmon parsers options:
#######################

# consult the documentation to get the full list of available options

# --mode fifo|colddata --> explicitly manage data in fifo/colddata
# --use_fqdn --> use the host fully qualified domain name (default)
# --silent --> minimize the processing output to save data volume (deactivated by default)

# In fifo mode, options are sent by the metricator_consumer.sh
# In file mode, options are sent by Splunk via the nmon_processing stanza in props.conf

nmonparser_options="--mode fifo --use_fqdn --silent"
Specially:
Option “–mode fifo|colddata” defines the mode for processing, this should be set to the default fifo for normal cases
Option “–use_fqdn” is used to define the hostname value during processing, by default this option is activated and the FQDN value of the guest server is used instead of the simple hostname value
Option “–silent” reduces the amount of information generated during the processing steps
The HEC technical addon “TA-metricator-for-nmon” has additional configurations items:
#######################
# nmon parsers options:
#######################

# consult the documentation to get the full list of available options

# --mode fifo|colddata --> explicitly manage data in fifo/colddata
# --use_fqdn --> use the host fully qualified domain name (default)
# --silent --> minimize the processing output to save data volume (deactivated by default)
# --no_local_log --> do no write metrics, events and config locally on file-syste, (activated by default)
# --splunk_http_url --> Splunk HEC endpoint URL (must contain the protocol, IP or FQDN and endpoint path)
# --splunk_http_token --> Splunk HEC token value
# --splunk_metrics_index --> Name of the metrics index (default: os-unix-nmon-metrics)
# --splunk_events_index --> Name of the events index (default: os-unix-nmon-events)
# --splunk_config_index --> Name of the config index (default: os-unix-nmon-config)

# In fifo mode, options are sent by the metricator_consumer.sh
# In file mode, options are sent by Splunk via the nmon_processing stanza in props.conf

#
# Splunk HEC configuration (http input)
#

# Change the Splunk URL to match your protocol (http vs https) and your access URL
# By default, as long the token value is not changed from the demonstration value above, the parser will just do nothing else than writing to local logs

# For more information, see: http://dev.splunk.com/view/event-collector/SP-CAAAE6M

# TO CONFIGURE:

# - create the "local" directory in /etc/nmon-logger
# - copy the default/nmon.conf to local/
# - manage your settings in your local nmon.conf

nmonparser_options="--mode fifo --use_fqdn --silent --no_local_log --splunk_http_url https://splunk.mydomain.com:8088/services/collector/event --splunk_http_token insert_your_splunk_http_token --splunk_metrics_index os-unix-nmon-metrics --splunk_events_index os-unix-nmon-events --splunk_config_index os-unix-nmon-config"