Deploy to single server instance
Installation for standalone instance
Standalone deployment: A single Splunk instance performs all roles
Splunk roles |
metricator-for-nmon |
SA-metricator-for-nmon |
TA-metricator-* |
|---|---|---|---|
Standalone |
X |
X (optional) |
X (optional) |
optional: The Technical Add-on provide nmon performance and configuration collection for the host than runs the add-on, which is optional
If using ITSI, the ITSI module can be deployed on the ITSI search head.
If you are new to Splunk, checkout:
https://docs.splunk.com/Documentation/Add-ons/released/Overview/Singleserverinstall
Installing with Splunk Web
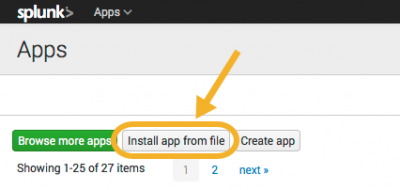
You can install the Application directly within Splunk Application management:
Access the Application manager:
Application Menu > Manage Apps
Install the applications from files
Manual installation
1. Upload the tgz archive files to your server
2. Un-archive
To install the application, simply un-archive the tgz file in the apps directory of Splunk, example:
cd /opt/splunk/etc/apps/
tar -xvf /tmp/metricator-for-nmon_*.tgz
Repeat the operation for any additional component stack to be deployed
3. And restart Splunk
/opt/splunk/bin/splunk restart
The Technical Add-on TA-metricator-for-nmon does not require initial configuration to start generating metrics and inventory data, as soon as it is deployed and Splunk restarted, the collection starts.
The Technical Add-on TA-metricator-hec-for-nmon requires additional configuration as exposed in the following section.
Indexes definition
Splunk does not allow third party applications to create custom indexes, without failing to be validated with appinspect.
Indexes can be created within the UI when Splunk is running as a standalone deployment, or manually:
Ideally create a local directory in the SA-metricator-for-nmon name space, and create the following indexes.conf:
# nmon data ingested as metrics
[os-unix-nmon-metrics]
disabled = false
coldPath = $SPLUNK_DB/os-unix-nmon-metrics/colddb
datatype = metric
homePath = $SPLUNK_DB/os-unix-nmon-metrics/db
splitByIndexKeys = metric_name,host
thawedPath = $SPLUNK_DB/os-unix-nmon-metrics/thaweddb

# nmon data ingested as regular events
[os-unix-nmon-events]
disabled = false
coldPath = $SPLUNK_DB/os-unix-nmon-events/colddb
homePath = $SPLUNK_DB/os-unix-nmon-events/db
thawedPath = $SPLUNK_DB/os-unix-nmon-events/thaweddb

# nmon config ingested as regular events
[os-unix-nmon-config]
disabled = false
coldPath = $SPLUNK_DB/os-unix-nmon-config/colddb
homePath = $SPLUNK_DB/os-unix-nmon-config/db
thawedPath = $SPLUNK_DB/os-unix-nmon-config/thaweddb

# nmon internal data
[os-unix-nmon-internal]
disabled = false
coldPath = $SPLUNK_DB/os-unix-nmon-internal/colddb
homePath = $SPLUNK_DB/os-unix-nmon-internal/db
thawedPath = $SPLUNK_DB/os-unix-nmon-internal/thaweddb
If you need customizations, for instance:
You are using Splunk Volumes (highly recommended)
You want specific indexes names to respect your own indexes naming convention or needs
mkdir /opt/splunk/etc/apps/SA-metricator-for-nmon/local
Then edit:
/opt/splunk/etc/apps/SA-metricator-for-nmon/local/indexes.conf
The following example could be used if you have a “primary:volume” for hot and warm buckets, and a “secondary:volume” for cold buckets:
# nmon data ingested as metrics
[os-unix-nmon-metrics]
disabled = false
coldPath = volume:secondary/os-unix-nmon-metrics/colddb
datatype = metric
homePath = volume:primary/os-unix-nmon-metrics/db
splitByIndexKeys = metric_name,host
thawedPath = $SPLUNK_DB/os-unix-nmon-metrics/thaweddb

# nmon data ingested as regular events
[os-unix-nmon-events]
disabled = false
coldPath = volume:secondary/os-unix-nmon-events/colddb
homePath = volume:primary/os-unix-nmon-events/db
thawedPath = $SPLUNK_DB/os-unix-nmon-events/thaweddb

# nmon config ingested as regular events
[os-unix-nmon-config]
disabled = false
coldPath = volume:secondary/os-unix-nmon-config/colddb
homePath = volume:primary/os-unix-nmon-config/db
thawedPath = $SPLUNK_DB/os-unix-nmon-config/thaweddb

# nmon internal data
[os-unix-nmon-internal]
disabled = false
coldPath = volume:secondary/os-unix-nmon-internal/colddb
homePath = volume:primary/os-unix-nmon-internal/db
thawedPath = $SPLUNK_DB/os-unix-nmon-internal/thaweddb
HTTP Event Collector configuration installation (only for TA-metricator-hec-for-nmon)
If using the Technical Addon for HEC, configuration an http input:
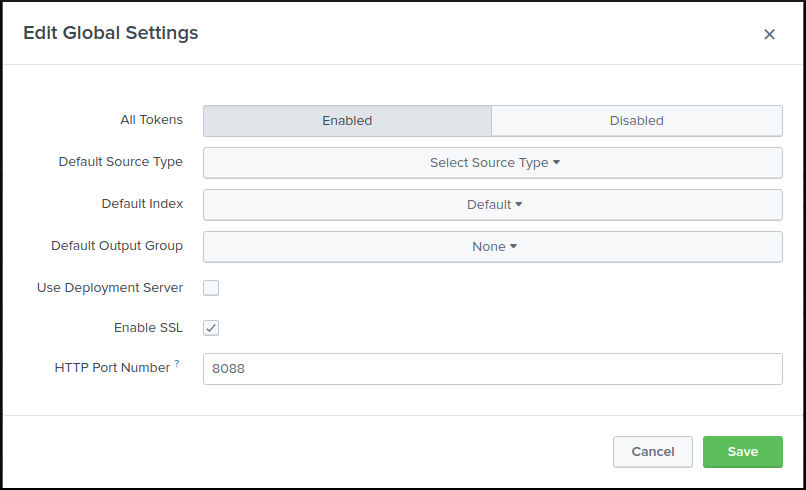
Settings / Data inputs / HTTP Event Collector
Click on “Global Settings” and activate the HTTP Event Collector:
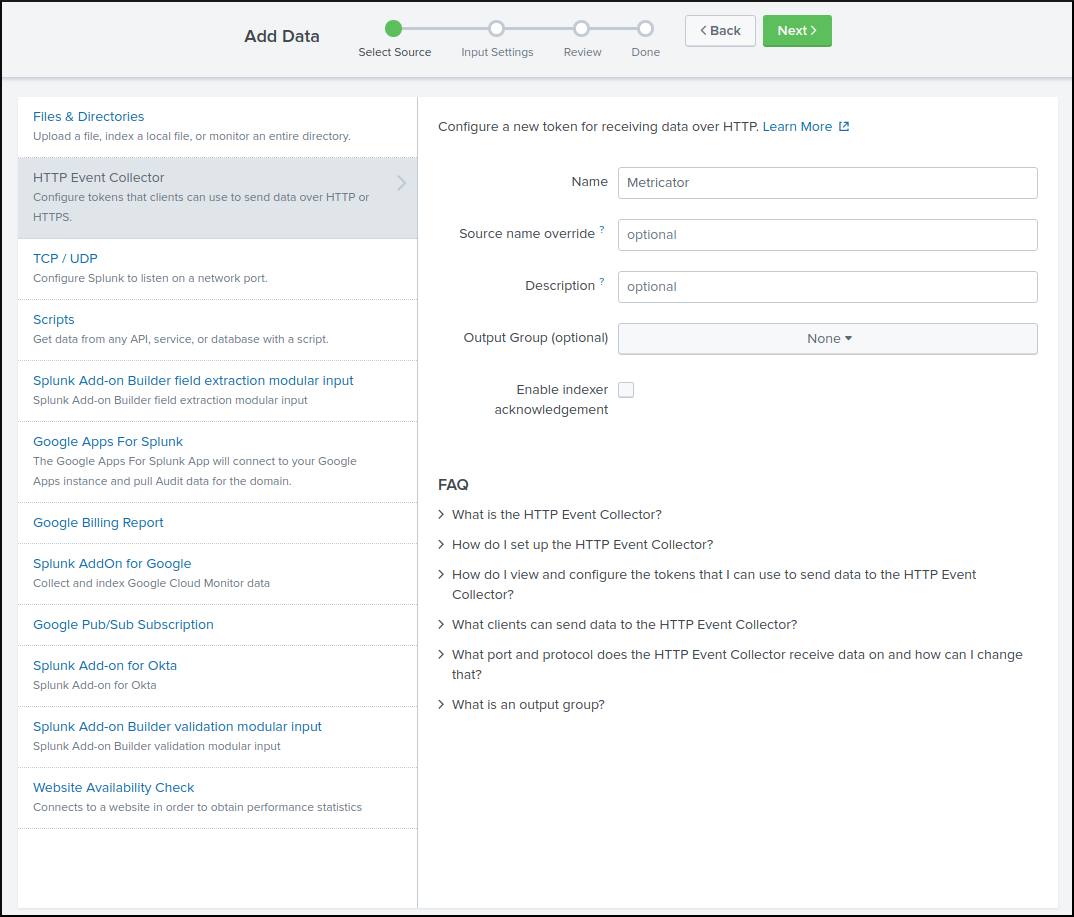
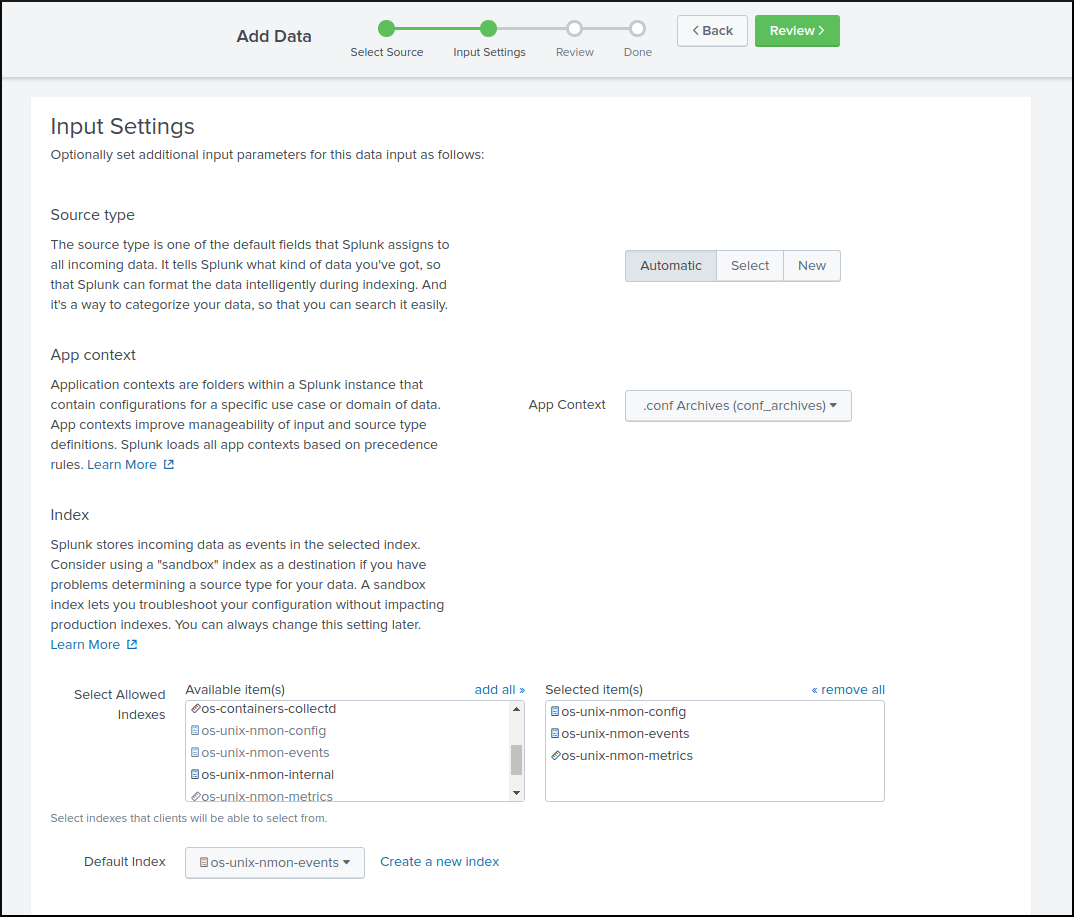
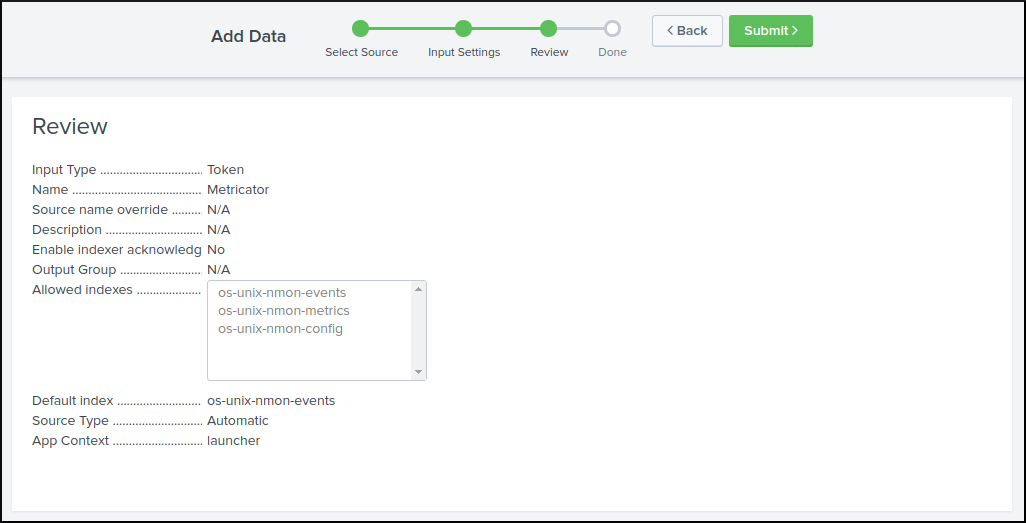
Now create a token to be used by the TA, the requirements are:
Source name override: Optional
Sourcetype: Automatic
Indexes allowed: os-unix-nmon-events, os-unix-nmon-metrics, os-unix-nmon-config
Default index: os-unix-nmon-events (unused, could be any of the indexes)
In Addition with the global configuration that activates the HEC service, this results in a configuration to be stored into an “inputs.conf” configuration file, such as:
[http://<input_name>]
disabled = 0
index = os-unix-nmon-events
indexes = os-unix-nmon-config,os-unix-nmon-events,os-unix-nmon-metrics
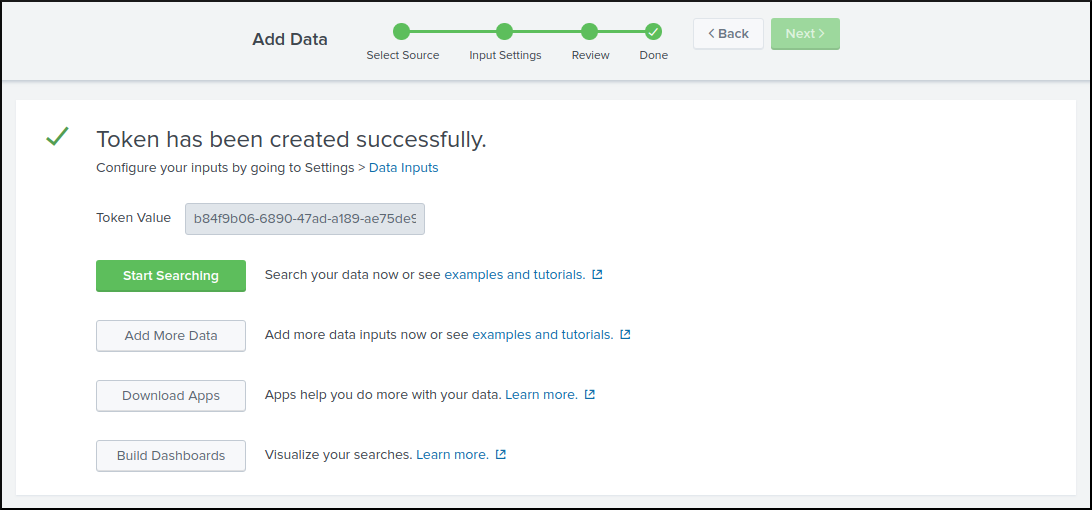
token = <token_value>
Take note of the protocol (http versus https) and the value of the token, and configure the TA:
Create a local directory in $SPLUNK_HOME/etc/apps/TA-metricator-hec-for-nmon
Copy default/nmon.conf to local/nmon.conf
Edit the nmonparser options and ensure to configure the Splunk HEC endpoint URL and the value of your token:
nmonparser_options="--mode fifo --use_fqdn --silent --no_local_log --splunk_http_url https://splunk.mydomain.com:8088/services/collector/event --splunk_http_token insert_your_splunk_http_token --splunk_metrics_index os-unix-nmon-metrics --splunk_events_index os-unix-nmon-events --splunk_config_index os-unix-nmon-config"
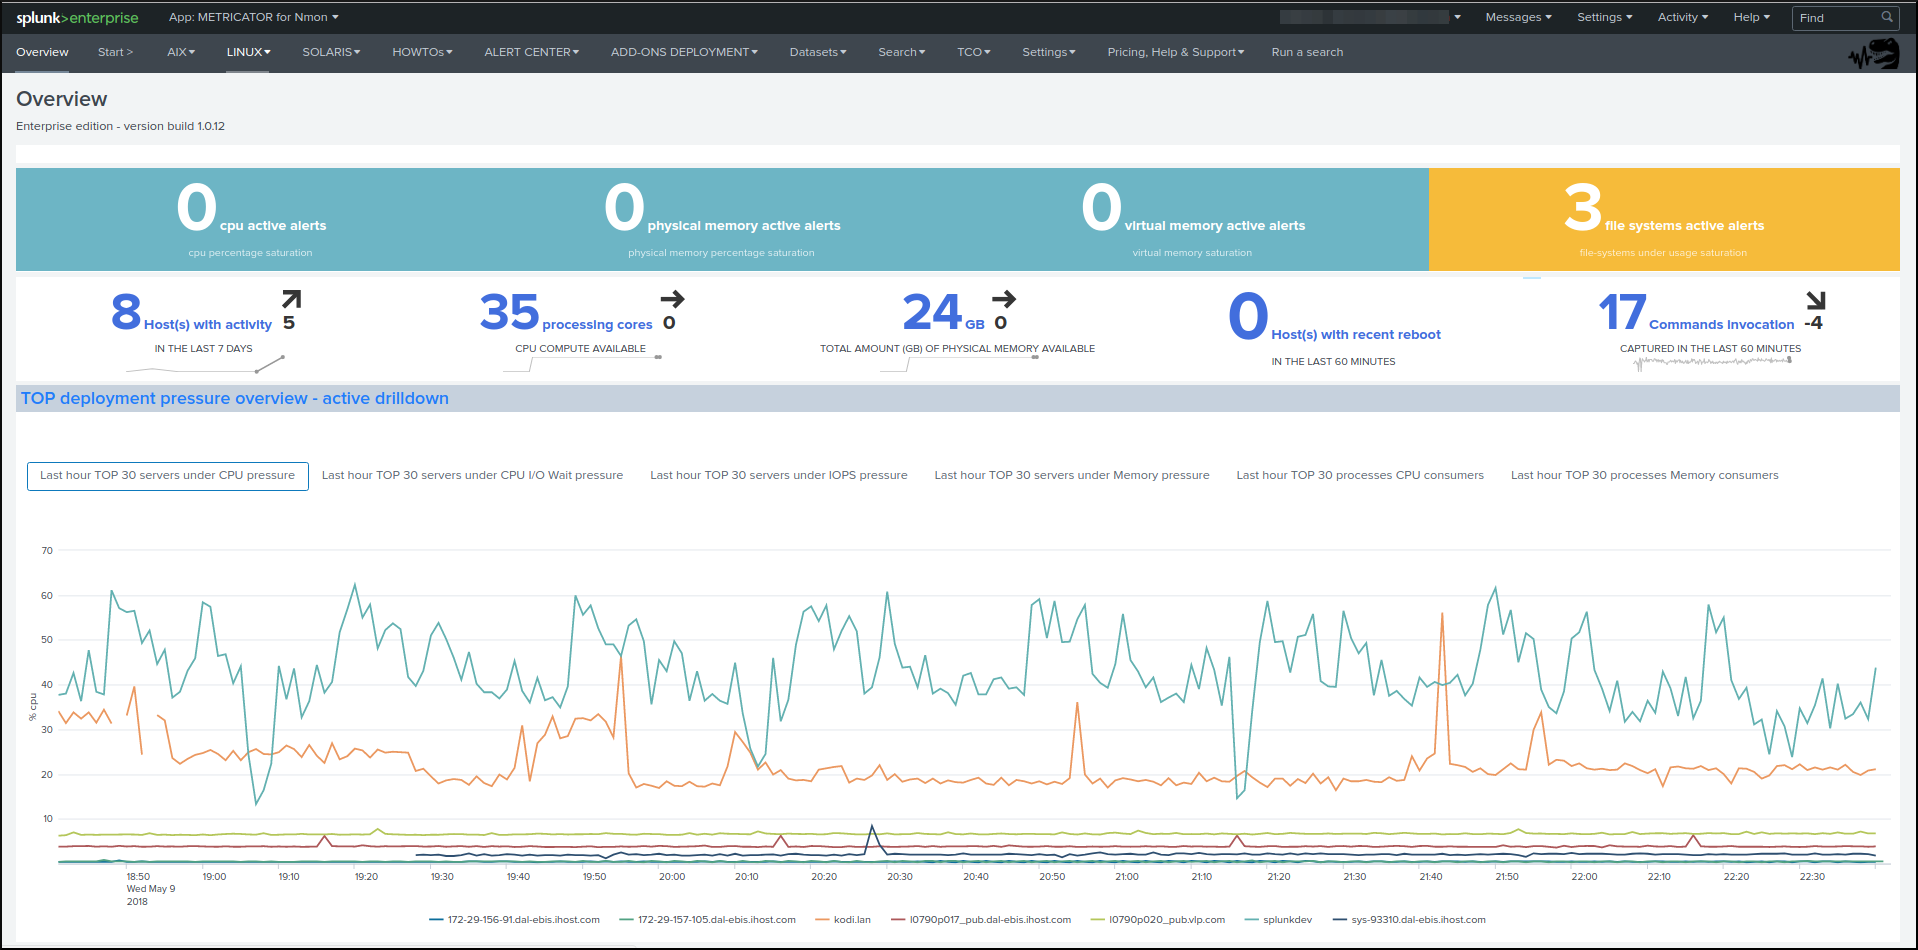
Access the Application
After Splunk restart, you can directly access the application: