Large scale deployment considerations
If you are planning to deploy the application stack in a large scale scenario for thousands of servers, please read the following documentation carefully.
The Metricator for Nmon can be easily deployed to thousands and thousands of nodes, however there are aspects that should be considered to optimize as much as possible your Splunk and Nmon deployment.
The following items will help you controlling and optimizing your Nmon deployment at a large scale.
Please also review the Total cost of Ownership documentation.
Data model acceleration
The metricator for Nmon uses Splunk metric store, and as such there are only 2 data models which are embedded within the metricator-for-nmon application:
metricator-nmon-config
metricator-nmon-processing
These data models are not accelerated by default for Splunk certification compliance purposes. However, enabling the acceleration for a very short period is strongly recommended to optimize related searches, such as the inventory lookup data generation.
Data model |
pre-set acceleration period |
recommended acceleration period |
|---|---|---|
metricator-nmon-config |
1 month |
1 month |
metricator-nmon-processing |
1 month |
1 month |
See metricator/default/datamodels.conf
Restricting the acceleration period of data models:
please refer to Splunk documentation: https://docs.splunk.com/Documentation/Splunk/latest/Admin/Datamodelsconf
You can easily customize the acceleration period by creating a local copy of the datamodels.conf under the “local” directory.
Acceleration setting of data models can also be managed directly in Splunk Web.
Settings / Data models:
Indexes settings, retention and rolling buckets
Hot DB bucket size for large volume:
If you are indexing 10GB or more per day, then you should set the maxDataSize, according to Splunk spec: https://docs.splunk.com/Documentation/Splunk/latest/Admin/Indexesconf
maxDataSize = auto_high_volume
This settings can take place in a local/indexes.conf configuration file of the PA-nmon, or the indexes.conf if you are not using the PA-nmon
Retention:
Ensure you set the retention of the nmon index according to your needs, See: http://docs.splunk.com/Documentation/Splunk/latest/Indexer/Setaretirementandarchivingpolicy
Rolling buckets and buckets management:
Ensure you set the better configuration possible according to your environment, such as using faster disks for hot and warm buckets.
For more information, See: https://docs.splunk.com/Documentation/Splunk/latest/Indexer/HowSplunkstoresindexes
Alerting customization
By default, the application has several alerting reports configured to run on a scheduled basis:
Alert name |
pre-set scheduling |
Indexes default scope |
|---|---|---|
NMON - file-systems under saturation |
Every 5 minutes |
index=os-unix-nmon-metrics* |
NMON - physical memory usage saturation |
Every 5 minutes |
index=os-unix-nmon-metrics* |
NMON - virtual usage saturation |
Every 5 minutes |
index=os-unix-nmon-metrics* |
NMON - cpu usage saturation |
Every 5 minutes |
index=os-unix-nmon-metrics* |
Notes: use the TCO dashboard to investigate the current performance of these searches
Depending on your need and constraints, you can eventually improve these searches by:
Adding specific constraints to the searches, such as including only Production servers if this is relevant
Restricting the searches indexes scope to match specific indexes which are relevant for your case
By default, these searches are optimized as much as possible to reduce their CPU time of costs for the Ssplunk infrastructure.
Baseline KVstore management
Nmon Performance for Splunk implements different KVstore known as the “baseline KVstores”, and used within the baseline interfaces.
These KVstore are being filled by scheduled reports and provide advanced analysis of usual system resources usage to help you determining anomalies on your systems.
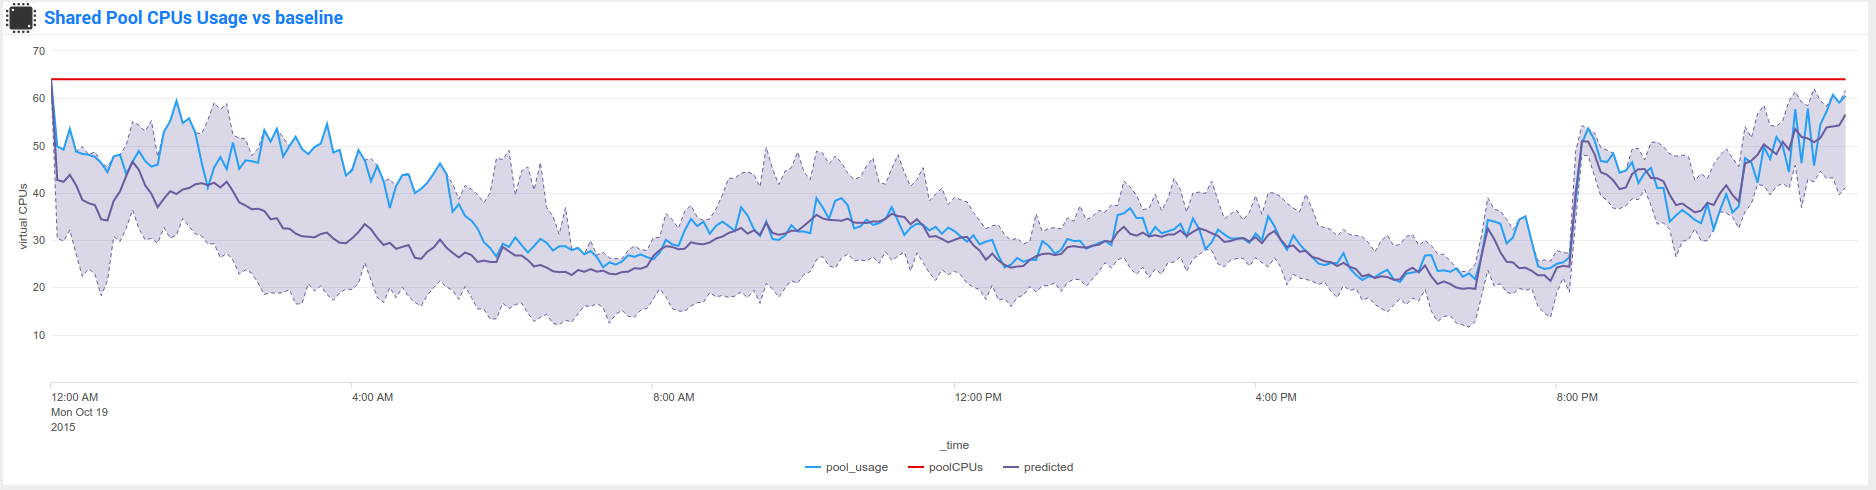
By default, the KVstores will contain data for all of the available servers within your deployment, in a large scale deployment you might want to limit these features to important servers, such as production servers only.
The following reports are being used to generate KVstore data once a week:
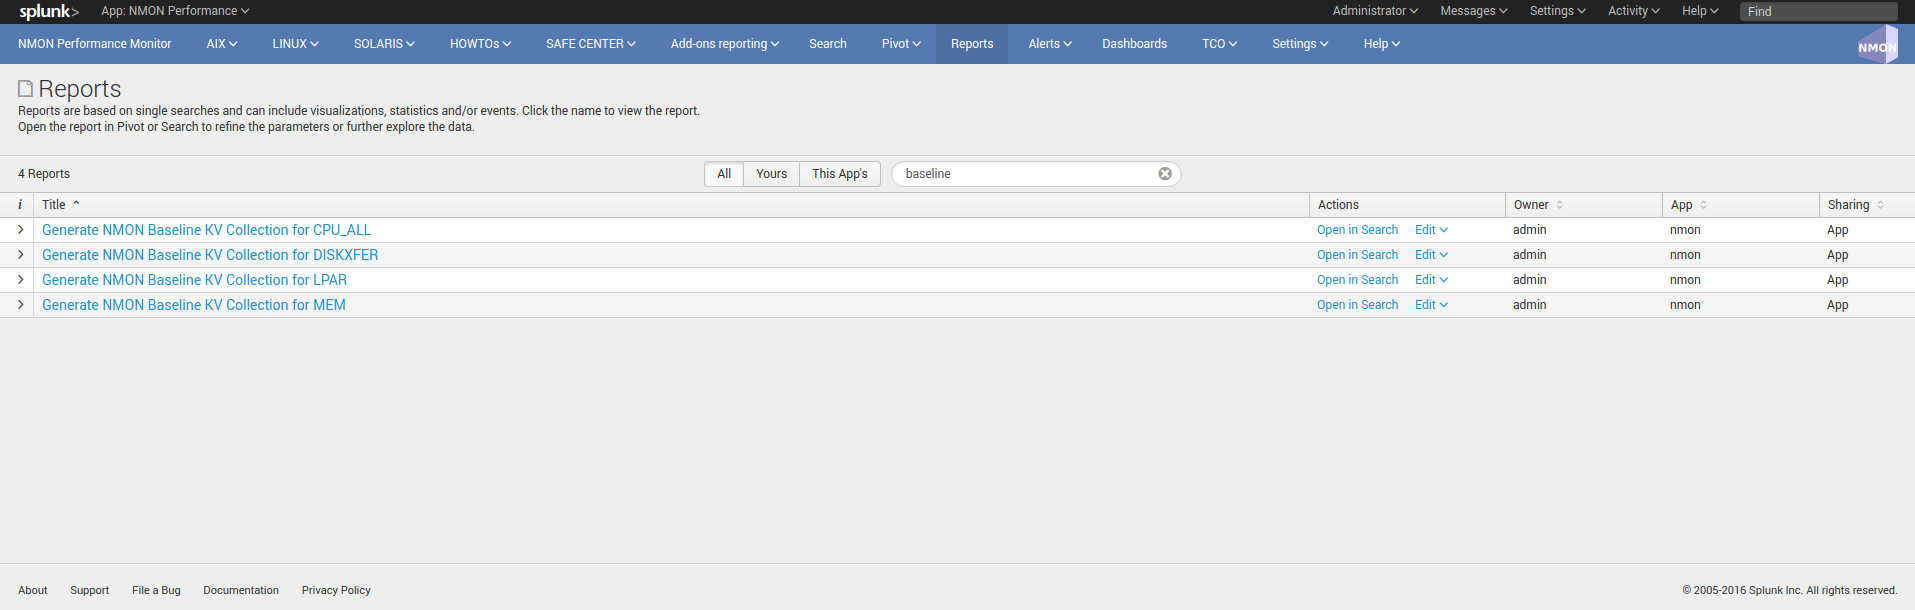
You can optionally customize these reports to filter out servers or focus on particular environment such as production servers only, which will limit the volume of data being stored in these KVstores.
Kvstores are hosted by search heads and do not need to be replicated to your indexers, resources that will be used to host these KVstores:
Storage: Very large KVstores containing data for thousands of server may require a few GB of storage on your search heads
Physical memory: As well, KVstores have physical memory costs, very large KVstores can impact your memory utilization on search heads
Reports runtime: The more server you have, the more time these reports might need to complete, they run by default on Sunday basis, you can manage the scheduling differently according to your own constraints
Open these reports in Splunk Web and modify the root search to limit the scope of the searches, you can also manage the searches in a local version of “savedsearches.conf”.
For upgrade resiliency considerations, do not modify the default/savedsearches.conf configuration file.
Managing nmon collection and volume of data
By default, the technical add-ons provided with the Nmon Performance application will generate performance data with a 1 minute accuracy between 2 performances collection.
These features can be easily controlled through an internal process using a customized version of the “nmon.conf” configuration file.
The TA-metricator-for-nmon is already slightly optimized to reduce the volume of data to be generated by expurging any useless metric, which is taken in consideration within each of the dashboards and searches.
However, you can choose to limit licence usage and storing costs by increasing the time between 2 performance collections, a common choice might be to increase this time to 2 or 3 minutes.