Technology Addon Troubleshooting guide
If you are running into trouble, please execute the following guide step by step.
Note that this guide is oriented in distributed deployment scenario, such that it focuses on issues you may encounter between Splunk and guest servers.
Step 1: Checking Splunk internal events
Checking Splunk internal events from your remote host (Universal or Heavy Forwarders) to Splunk
In case of trouble with remote hosts, you should always start by verifying that you successfully receive Splunk internal, this simple step validates:
That your remote hosts are able to send data to your indexers
That your basic deployment items (such as outputs.conf) are correctly configured
The main log file you should care about is the “splunkd.log”, which content is indexed in the “_internal” index
INFORMATION: In default configuration, internal indexes cannot be accessed by non privileged users (unless Splunk admin gives the access rights), this step requires admin access or access authorization to internal indexes
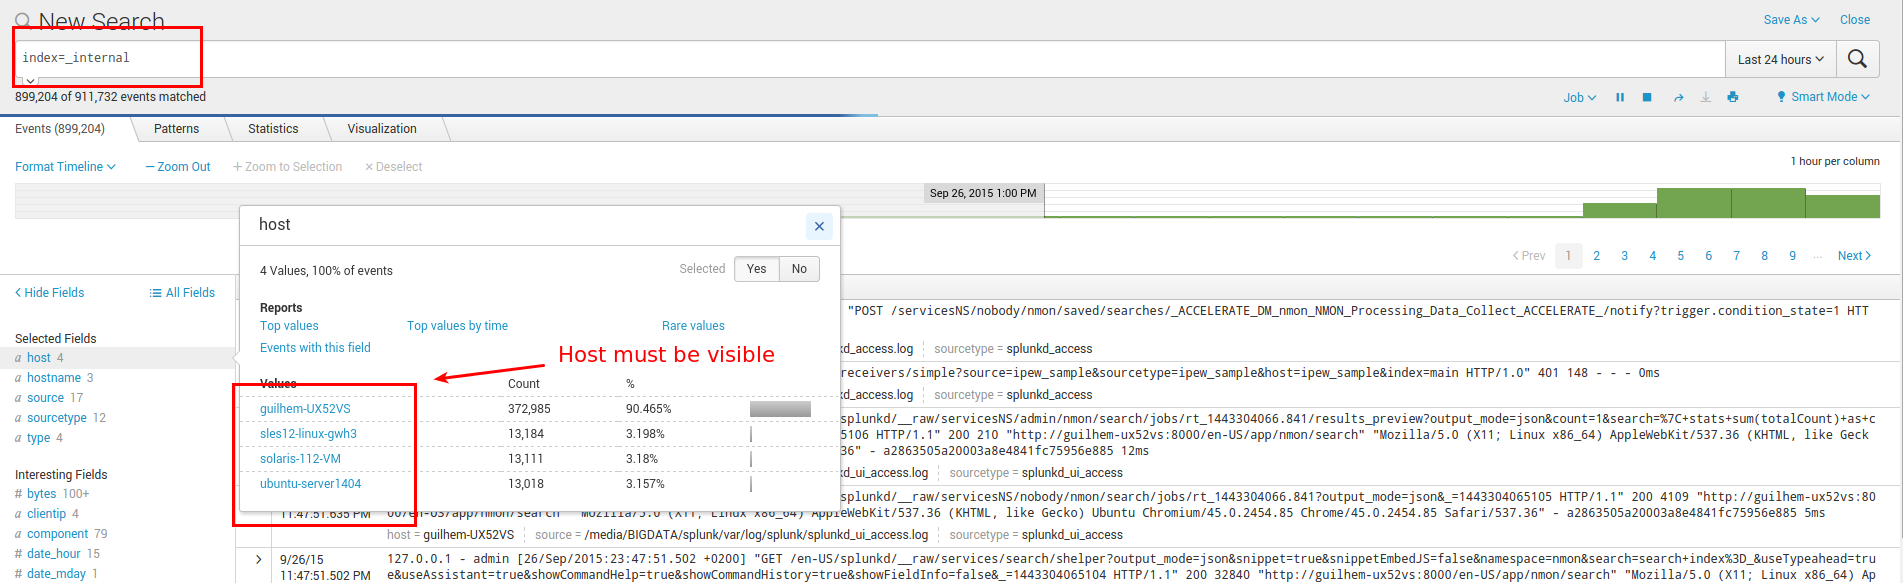
Focus on splunkd sourcetype and host(s) you are verifying:
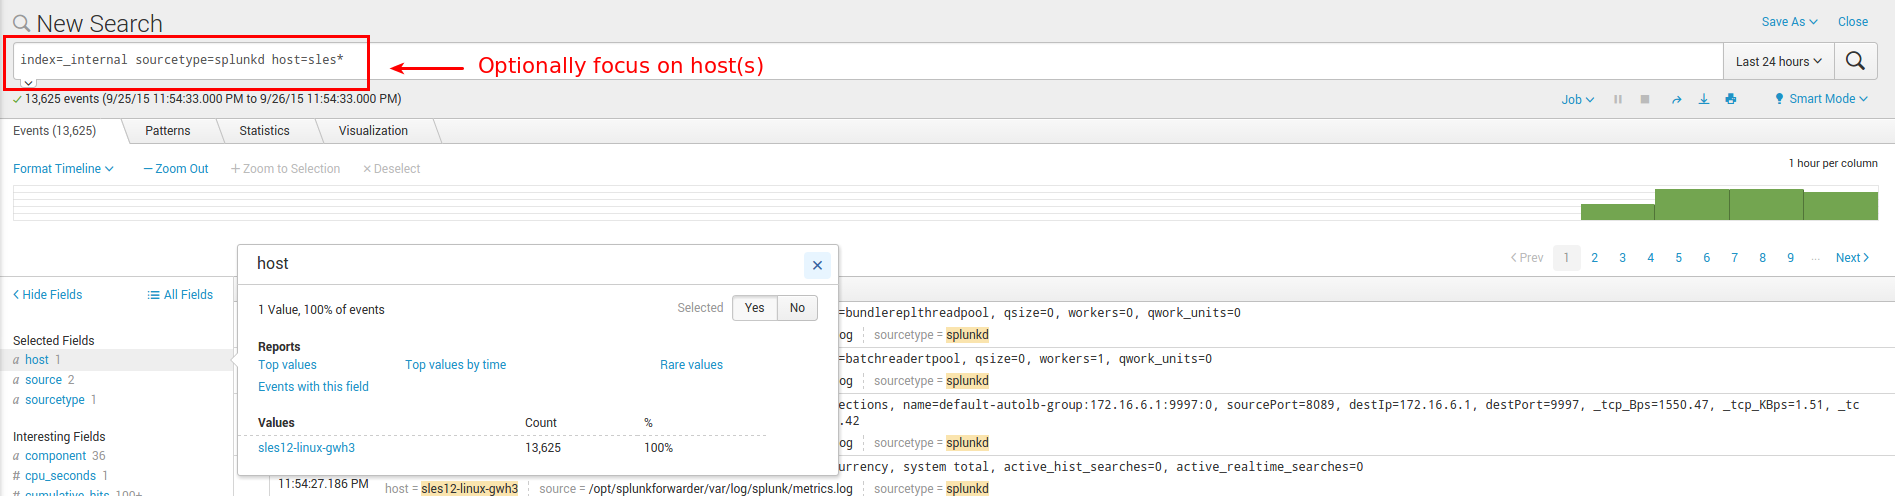
If you successfully found incoming events for your host(s), swith to step 2.
If you can’t find incoming events for your host(s), common root causes could be:
Network connection failure between you host(s) and indexers (or intermediate collectors): Verify with a simple telnet connection test that you can access to destination IP and port(s)
Bad information in outputs.conf (check IP / Port, syntax)
No outputs.conf deployed to Universal or Heavy Forwarder
In such a case, connect directly to the host and verify messages in:
/opt/splunkforwarder/var/log/splunkd.log
Step 2: Technology Addon verifications
Running processes in machine
Several processes shoud be found in machine, at initial run you will find fifo_reader processes (output might differ specially for paths):
Using Python interpreter: (Universal Forwarder example)
python /opt/splunkforwarder/etc/apps/TA-metricator-for-nmon/bin/metricator_reader.py --fifo fifo1
/bin/sh -c /opt/splunkforwarder/etc/apps/TA-metricator-for-nmon/bin/metricator_reader.sh /opt/splunkforwarder/var/log/metricator/var/nmon_repository/fifo1/nmon.fifo
/bin/sh /opt/splunkforwarder/etc/apps/TA-metricator-for-nmon/bin/metricator_reader.sh /opt/splunkforwarder/var/log/metricator/var/nmon_repository/fifo1/nmon.fifo
Using Perl interpreter: (Universal Forwarder example)
/usr/bin/perl /opt/splunkforwarder/etc/apps/TA-metricator-for-nmon/bin/metricator_reader.pl --fifo fifo1
/bin/sh /opt/splunkforwarder/etc/apps/TA-metricator-for-nmon/bin/metricator_reader.sh /opt/splunkforwarder/var/log/metricator/var/nmon_repository/fifo1/nmon.fifo
The startup operation will be visible by a message logged:
eventtype=nmon:collect starting fifo_reader
Example:
12-02-2018 05:12:14, sys-91371.dal-ebis.ihost.com INFO: starting the fifo_reader fifo1
In addition, you will find an nmon binary instance running, example: (output will differ depending on operating systems and settings)
/opt/splunkforwarder/var/log/metricator/bin/linux/rhel/nmon_power_64_rhel6_be -F /opt/splunkforwarder/var/log/metricator/var/nmon_repository/fifo1/nmon.fifo -T -s 60 -c 1440 -d 1500 -g auto -D -p
The startup operation will be visible by a message logged:
eventtype=nmon:collect starting nmon
Example:
12-02-2018 05:12:15, sys-91371.dal-ebis.ihost.com INFO: starting nmon : /opt/splunkforwarder/var/log/metricator/bin/linux/sles/nmon_power_64_sles12_le -F /opt/splunkforwarder/var/log/metricator/var/nmon_repository/fifo1/nmon.fifo -T -s 60 -c 1440 -d 1500 -g auto -D -p in /opt/splunkforwarder/var/log/metricator/var/nmon_repository/fifo1
If you cannot find the relevant processes:
If for some unexpected issues you cannot find the processes in machine, you can try the following actions:
checking manual start:
stop the Splunk instance:
/opt/splunkforwarder/bin/splunk stop
check and kill any resilient processes
execute the following command and observe any additional output:
/opt/splunkforwarder/bin/splunk cmd /opt/splunkforwarder/etc/apps/TA-metricator-for-nmon/bin/metricator_helper.sh
nmon processes coring:
It might happen that for some unexpected reasons the nmon process that was identified as the target can’t start successfully on the server.
The manual run of the metricator_helper.sh provides the nmon command with arguments, which you can try running manually except the “-F” option and fifo file path to be replaced with the “-f” option.
You can start an nmon processes writing to a regular file, example:
/opt/splunkforwarder/var/log/metricator/bin/linux/sles/nmon_power_64_sles12_le -f -T -s 60 -c 1440 -d 1500 -g auto -D -p
Checking the data parsing
The parsing of those dat files is being achieved in 2 main steps:
The “bin/metricator_consumer.sh” script is started every 60 seconds by Splunk
This script will check if an nmon_data.dat file exists and that its size is greater than 0
If the size of the nmon_dat.data file equals to 0, then the metricator_consumer.sh has nothing to do and will exit this fifo file
If the size is greater than 0 but its modification time (mtime) is less than 5 seconds, the script will loop until the condition is true
The metricator_consumer.sh reads the dat file, recompose the nmon file and stream its content to the “bin/nmonparser.sh” shell wrapper
After this operation, the nmon_data.dat file will be empty for the next cycle
The shell wrapper reads in stdin the data, and send it to the parsers (bin/nmonparser.pl|.py)
The parser reads the nmon data, parses it and produces the final files to be indexed by Splunk
You can easily run the metricator_consumer.sh manually: (Splunk needs to be stopped)
/opt/splunkforwarder/bin/splunk cmd /opt/splunkforwarder/etc/apps/TA-nmon/bin/metricator_consumer.sh
The files to be indexed by Splunk can be found in:
/opt/splunkforwarder/var/log/metricator/var/csv_repository
/opt/splunkforwarder/var/log/metricator/var/config_repository
Step 3: processing traces in Splunk
The activity of “bin/metricator_helper.sh” is logged in Splunk: (startup of fifo_reader and nmon processes)
eventtype=nmon:collect
The activity of “bin/metricator_consumer.sh” and parsers is logged in Splunk:
eventtype=nmon:processing
Data files for the TA-metricator-for-nmon
Splunk indexing of batch csv files is logged in Splunk:
**Once the data processing steps have been achieved, several csv flow files are generated and consumed by Splunk in batch mode. (index and delete)**
The traces of these activities are visible in Splunk using the following search:
index=_internal sourcetype=splunkd host=<server hostname> batch input
Example:
02-12-2018 10:01:09.073 -0500 INFO  TailReader - Batch input finished reading file='/opt/splunkforwarder/var/log/metricator/var/csv_repository/sys-91367.dal-ebis.ihost.com_01_DGBACKLOG.metrics.csv'
02-12-2018 10:01:09.073 -0500 INFO  TailReader - Batch input finished reading file='/opt/splunkforwarder/var/log/metricator/var/csv_repository/sys-91367.dal-ebis.ihost.com_01_DGIOTIME.metrics.csv'
02-12-2018 10:01:09.072 -0500 INFO  TailReader - Batch input finished reading file='/opt/splunkforwarder/var/log/metricator/var/csv_repository/sys-91367.dal-ebis.ihost.com_01_DGWRITESERV.metrics.csv'
02-12-2018 10:01:09.072 -0500 INFO  TailReader - Batch input finished reading file='/opt/splunkforwarder/var/log/metricator/var/csv_repository/sys-91367.dal-ebis.ihost.com_01_DGWRITEMERGE.metrics.csv'
02-12-2018 10:01:09.071 -0500 INFO  TailReader - Batch input finished reading file='/opt/splunkforwarder/var/log/metricator/var/csv_repository/sys-91367.dal-ebis.ihost.com_01_DGWRITES.metrics.csv'
Immediately after the files consumption, the metrics and events are available in Splunk.
Data files for the TA-metricator-hec-for-nmon
The TA-metricator-hec-for-nmon process and forward the nmon data transparently and silently over http using batch files and the curl binary available on the system.
By default, there are no remaining traces of these data on the file-system, this is controlled by the following setting in “nmon.conf”:
--no_local_log --> do no write metrics, events and config locally on file-syste, (activated by default)

nmonparser_options="--mode fifo --use_fqdn --silent --no_local_log --splunk_http_url https://splunk.mydomain.com:8088/services/collector/event --splunk_http_token insert_your_splunk_http_token --splunk_metrics_index os-unix-nmon-metrics --splunk_events_index os-unix-nmon-events --splunk_config_index os-unix-nmon-config"
If you remove this option on next iteration of the metricator_consumer.sh script, the following log files will be available:
$SPLUNK_HOME/var/log/metricator/var/nmon_perfdata_metrics.log
$SPLUNK_HOME/var/log/metricator/var/nmon_perfdata_events.log
$SPLUNK_HOME/var/log/metricator/var/nmon_configdata.log
Note: the nmon_configdata.log will only be generated at the first execution of an nmon binary life cycle.
There are no rotation operated by the TA, as such this option is not intended to be used out of trouble shooting purposes or these log files will grow continuously.
Step 4: data availability in Splunk
Metrics stored as events can be retrieved using the following search:
eventtype=nmon:events
Metrics stored in the metric in the metric stored can be retrieved using mcatalog:
| mcatalog values(metric_name) as metric_name values(_dims) as dimensions where `nmon_metrics_index` metric_name=os.unix.nmon.* host=*
And metrics values using the mstats command, example:
| mstats avg(_value) as value where `nmon_metrics_index` metric_name=os.unix.nmon.cpu.cpu_all.Sys_PCT host=* groupby host span=1s